Categories
Investor Insights & Opportunities

Private-Equity Business Intelligence: Data-Driven Deal Insights

Private equity thrives on precision, and business intelligence (BI) has become the cornerstone of informed decision-making in this competitive field. By harnessing data-driven insights, firms can uncover hidden opportunities, mitigate risks, and optimize deal strategies. Whether it’s evaluating market trends or forecasting financial outcomes, BI tools empower investors to make confident, evidence-based choices.

Your evaluation of forecasting methods is complemented by perspectives on the best financial forecasting software for startups, detailing various software options to aid in accurate predictions.

This article explores how private equity professionals can use BI to gain a competitive edge, offering strategies, case studies, and actionable tips. Let’s jump right in to discover how data transforms decision-making in private equity.

Build Your Data Foundation with Business Intelligence in Private Equity

Business intelligence (BI) is transforming how private equity firms operate, offering a structured approach to collecting, storing, and analyzing data for smarter decision-making. By harnessing BI, firms can uncover actionable insights that enhance deal sourcing and portfolio management, ultimately driving stronger returns.

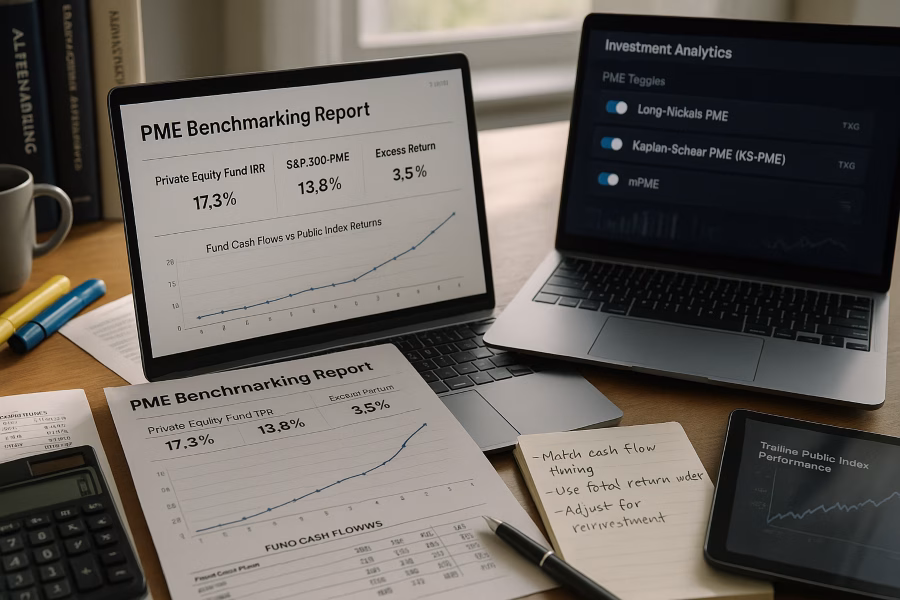
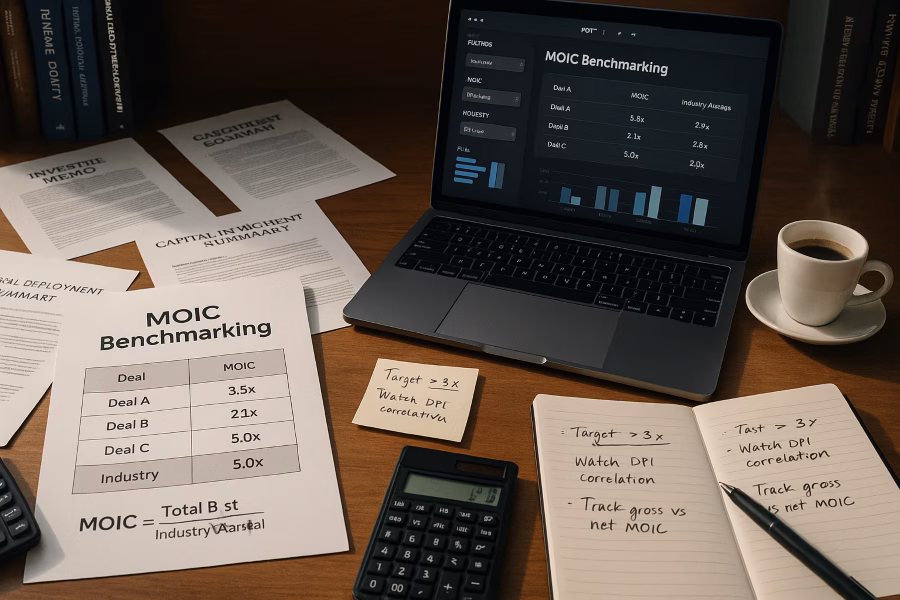
In private equity, the ability to process data quickly and visualize it effectively is critical. Interactive dashboards, powered by advanced BI tools, enable firms to monitor key performance indicators (KPIs) across their portfolio in real time. This ensures timely decisions that align with market trends and investment goals.

The global private equity market, valued at $787 billion in 2024, is projected to grow at a compound annual growth rate (CAGR) of 8.73% through 2033. This growth underscores the importance of adopting robust BI solutions to capitalize on emerging opportunities. For example, AI-driven BI tools are revolutionizing the industry by enabling faster data processing and improving deal sourcing efficiency.

To stay ahead, private equity firms can also explore sector-specific innovations. In retail-focused portfolio companies, consider examples like Retail Tech, which highlights market disruptors that can inform investment strategies.

How Business Intelligence Boosts Your Competitive Edge and Efficiency

Business Intelligence (BI) tools are transforming decision-making processes for private equity firms, enabling them to thrive in a data-driven environment. By harnessing reliable, data-backed insights, these tools empower firms to make informed choices that drive operational efficiency and sharpen their competitive edge.

Real-Time Insights for Smarter Decisions

BI tools provide private equity firms with access to real-time metrics, allowing them to track performance and identify opportunities as they arise. This capability is particularly crucial in an industry forecasted to grow from $460 billion in 2024 to $765 billion by 2027, as highlighted in the U.S. PE Market Forecast. Such projections underscore the expanding scope of BI-driven opportunities, making timely data analysis indispensable for staying ahead.

Enhanced Efficiency Through Deep Data Analysis

Operational efficiency is another key benefit of BI frameworks. By analyzing vast amounts of data, firms can streamline processes, reduce redundancies, and allocate resources more effectively. This focus on efficiency not only improves day-to-day operations but also enhances long-term profitability.

Governance and Metrics Tracking

Robust governance is supported by BI frameworks, which ensure that firms adhere to compliance standards while maintaining transparency. Additionally, these tools simplify the tracking of key performance metrics, a trend increasingly embraced by private equity firms. As noted in the PE Trend, adopting dashboard technologies has become essential for pinpointing critical data points and optimizing strategies.

By integrating BI tools into their operations, private equity firms can achieve unparalleled efficiency and gain a competitive edge in a rapidly evolving market.

Create a Winning Business Intelligence Strategy for Data-Driven Results

A successful Business Intelligence (BI) strategy in private equity hinges on the seamless integration of high-quality data and scalable systems. By focusing on master data management, data governance, and efficient ETL processes, firms can unlock actionable insights that drive strategic decision-making and operational efficiency.

1. Establishing Master Data Management for Consistency

Master Data Management (MDM) is the cornerstone of any effective BI strategy. It ensures a single source of truth across portfolio companies, eliminating discrepancies and enabling consistent reporting. For private equity firms managing diverse investments, MDM simplifies the consolidation of financial, operational, and transactional data. This unified approach not only enhances data accuracy but also accelerates decision-making processes.

2. Implementing Robust Data Governance

Data governance is essential for maintaining the integrity and security of sensitive information. A well-defined governance framework establishes clear protocols for data access, usage, and compliance. For example, when addressing ESG-related compliance, the collaboration between Deloitte, Informatica, and Workiva serves as a model for aligning governance practices with regulatory requirements. Deloitte ESG demonstrates how thoughtful governance can simplify complex data management challenges.

3. Optimizing ETL Processes for Efficiency

Efficient ETL (Extract, Transform, Load) processes are vital for converting raw data into actionable insights. By automating data extraction and transformation, private equity firms can reduce manual errors and improve scalability. Streamlined ETL workflows also enable faster integration of new portfolio companies, ensuring that decision-makers have access to timely and accurate data.

4. Leveraging Real-Time Data Stores

Real-time operational data stores empower firms to make informed decisions based on up-to-the-minute information. These systems provide immediate visibility into key performance indicators, enabling proactive responses to market changes. For instance, transactional data analysis and vendor renegotiations led to $850K recovered in less than an hour for a Capstone Partners client. This case study highlights the rapid ROI achievable through a well-executed BI strategy.

5. Connecting BI to Broader Financial Modeling

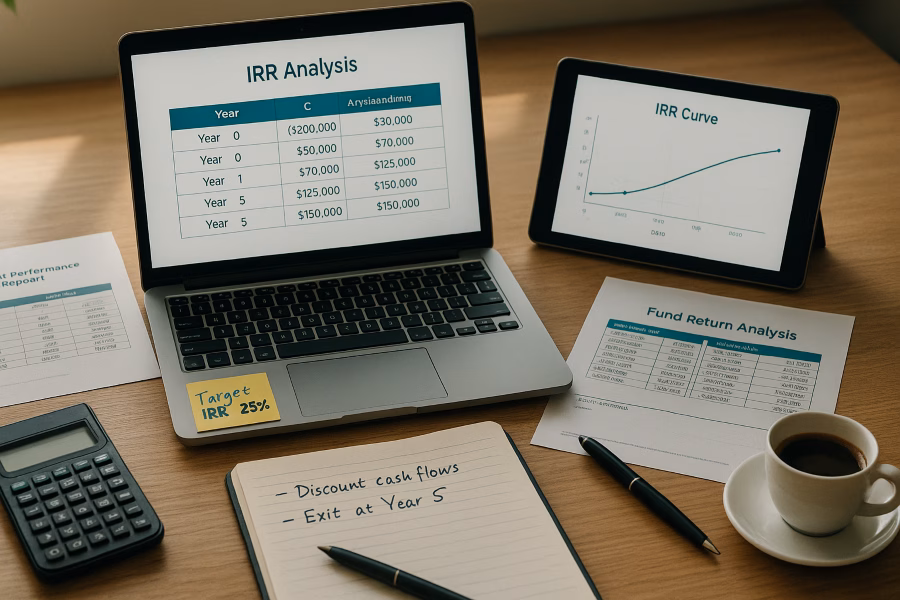
A robust BI strategy complements broader financial modeling practices, such as scenario analysis and investor-focused projections. Additionally, insights from how to create a financial model for investors provide foundational knowledge for constructing projections that attract stakeholders.

Business Intelligence (BI) tools have evolved far beyond the limitations of traditional spreadsheets, offering businesses the ability to uncover deeper insights and make data-driven decisions with precision. While spreadsheets remain a staple for basic data organization, they often fail to meet the demands of modern BI, such as real-time analytics and dynamic visualization.

Advanced BI tools now integrate machine learning (ML) capabilities, enabling streamlined data processing and predictive analytics. These ML-driven solutions empower businesses to identify patterns and trends that might otherwise go unnoticed, providing actionable insights to stay ahead in competitive markets.

Interactive dashboards are another standout feature of modern BI tools. Unlike static reports, these dashboards allow users to explore data in real time, customizing views and drilling down into specifics. This functionality ensures that decision-makers have access to the most relevant information at any given moment.

For businesses in private equity or finance, incorporating AI-driven tools can further enhance analytics capabilities. A technical overview of ai financial modeling tools illustrates how these innovations can streamline and optimize your projection processes, offering unparalleled accuracy and efficiency.

By embracing advanced BI tools, businesses can transform raw data into meaningful insights, fostering smarter strategies and improved outcomes. Whether through ML-driven solutions or interactive dashboards, these tools are redefining how organizations approach analytics and decision-making.

What’s Next for Business Intelligence in Private Equity Analytics?

Artificial intelligence (AI) and machine learning (ML) are reshaping the future of BI, offering private equity firms unparalleled tools for data-driven decision-making. These technologies enable deeper insights by automating complex data analysis, identifying patterns, and predicting trends with remarkable accuracy. As a result, firms can make more informed investment decisions, optimize portfolio performance, and uncover opportunities that might otherwise go unnoticed.

Real-time analytics is another game-changer, empowering firms to adapt their strategies dynamically in response to market fluctuations. With access to up-to-the-minute data, decision-makers can evaluate risks, seize emerging opportunities, and refine their approaches without delay. This agility is particularly critical in the fast-paced private equity landscape, where timing can significantly impact outcomes.

Moreover, integrating real-time BI into operational workflows enhances ongoing stress testing and scenario planning. For example, a review of model robustness incorporates examples from how to stress test financial models, offering insights into the methods used for evaluating resilience under varying conditions. This ensures that firms remain prepared for both anticipated and unforeseen challenges.

As AI in Business Intelligence continues to evolve, private equity firms must stay ahead by adopting these cutting-edge tools. The ability to harness AI, ML, and real-time analytics will not only streamline operations but also provide a competitive edge in an increasingly data-driven industry.

How Allvue Systems Offers Custom BI Solutions for Private Equity

Private equity firms often face unique challenges in managing data and tracking performance across their portfolios. Allvue Systems addresses these complexities by delivering tailored BI software solutions designed specifically for private equity needs.

With Allvue’s BI solutions, firms gain access to customized dashboards that simplify decision-making. These dashboards integrate analytics and visualization tools, allowing users to track portfolio performance and monitor deal sourcing with precision. The software’s user-friendly interface ensures that even complex data is presented in an intuitive format, enabling teams to focus on strategic insights rather than data interpretation.

By offering tailored visualization and performance tracking, Allvue Systems empowers private equity firms to streamline operations and enhance oversight.

Fragmented data can be a silent obstacle for private equity firms aiming to optimize their investment strategies. Relying on traditional spreadsheets often results in isolated data silos, making it difficult to perform comprehensive performance analysis across portfolios. These silos not only slow decision-making but also hinder the ability to identify opportunities and risks effectively.

Conclusion

Business Intelligence (BI) solutions offer a transformative approach by consolidating data into unified, real-time dashboards. With cross-portfolio analytics, firms can access actionable insights that drive faster and smarter investment decisions. Breaking down fragmented data is no longer optional—it’s essential for developing competitive strategies in a rapidly evolving market.

If you’re looking to secure the right investors, we at Qubit Capital can help with our Investor Outreach service. Enhance your investor relations with data-driven insights that align with your firm’s goals.

Key Takeaways

  • Strong business intelligence is crucial for informed decision-making in private equity
  • Master data management and data governance reduce data silos and improve consistency
  • Actionable BI strategies enhance deal sourcing and boost portfolio performance
  • Advanced tools and real-time analytics provide a competitive edge
  • Effective BI integration strengthens investor relations and operational efficiency
Categories
Financial Modeling

PME Benchmarking: Measuring PE Fund Performance Against Public Markets

Private equity (PE) investors often face the challenge of evaluating fund performance in a way that accounts for market dynamics. PME (Public Market Equivalent) benchmarking offers a solution by comparing PE fund returns against public market indices. This quantitative approach provides a clearer picture of whether a fund is outperforming or underperforming relative to broader market trends.

Understanding how PME benchmarking works is essential for investors aiming to make informed decisions. For instance, integrating tools like scenario analysis can enhance this evaluation process. An exploration of how to perform scenario analysis in financial modeling adds depth to your review by detailing approaches for evaluating financial resilience under variable conditions.

This blog dives into actionable methodologies and case studies to help you measure PE fund performance effectively. Let’s jump right in!

Your Key Takeaways from PME Benchmarking

PME benchmarking offers a transformative approach to evaluating private equity fund performance by comparing it against public market returns. This methodology addresses the long-standing challenge of reconciling discrepancies between internal rate of return (IRR) metrics and the actual performance of public markets.

Advanced benchmarking techniques, such as the Long-Nickels PME and Kaplan-Schoar PME, provide precise insights into fund performance by incorporating key data points like cash flows and market indices. These methods not only enhance transparency but also empower investors to make informed decisions based on a clearer understanding of relative returns.

What You Need to Know About the Private Investment J-Curve

Private investments often follow a predictable trajectory known as the J-curve, which reflects the typical performance pattern of funds over time. Early in a fund’s lifecycle, returns may appear negative due to upfront costs, management fees, and the gradual deployment of capital into investments. This initial dip can be challenging for investors who expect immediate gains, but it is a natural part of the maturation process.

As the fund progresses, investments begin to generate returns, and the curve shifts upward, eventually stabilizing. This upward movement is driven by successful exits, improved portfolio performance, and the reduction of early-stage expenses. Understanding this phenomenon is crucial for investors aiming to assess fund performance accurately over its lifecycle.

For those seeking to refine their projections and benchmarking frameworks, modern tools like ai financial modeling tools can enhance accuracy. These tools integrate seamlessly with your PME benchmarking framework, offering insights into long-term trends and helping investors navigate the complexities of early-stage performance.

How to Measure Fund Success with Performance Calculations

Two widely used methodologies—Internal Rate of Return (IRR) and Time-Weighted Return (TWR)—offer distinct approaches to evaluating fund performance, each with its own strengths and limitations.

IRR vs. TWR: Key Differences

IRR measures the annualized rate of return on invested capital, factoring in the timing and magnitude of cash flows. It’s particularly useful for private equity and venture capital funds, where cash flows are irregular. However, IRR can be sensitive to the timing of cash flows, potentially skewing results if early distributions are significant.

On the other hand, TWR focuses on the fund’s overall performance, independent of cash flow timing. It’s ideal for comparing funds or portfolios with varying investment periods, as it neutralizes the impact of external cash flows. Unlike IRR, TWR provides a clearer picture of the manager’s investment skill over time.

Why These Metrics May Not Align

While IRR and TWR both aim to quantify fund performance, they often diverge due to their calculation methods. IRR emphasizes cash flow timing, which can amplify returns in funds with early distributions. TWR, however, prioritizes consistency, making it less susceptible to timing distortions. This divergence underscores the importance of using both metrics for a comprehensive evaluation.

Benchmarking with PME

To ensure robust benchmarking, funds often employ Public Market Equivalent (PME) comparisons alongside IRR and TWR. PME evaluates fund performance against public market indices, offering a broader perspective on relative success. Incorporating PME into your analysis can highlight whether a fund is outperforming or underperforming market standards.

For a deeper dive into assessing model resilience during market fluctuations, explore how to stress test financial models.

Why Time and Maturity Matter in Long-Term Returns

Understanding fund performance requires patience and a long-term perspective. Private investment funds often take years to settle into their final quartile rankings, making early assessments less reliable. On average, funds achieve their ultimate quartile ranking between 5.8 and 6.8 years, a period referred to as their “settle age.” This timeline underscores the importance of evaluating performance over extended horizons rather than relying on short-term metrics.

The concept of “settle age” is pivotal in assessing fund maturity. Data shows that funds typically need around six years to stabilize within their quartile rankings relative to peers. This gradual convergence allows investors to make more informed decisions based on consistent trends rather than fluctuating early-stage returns. Similarly, discrepancies between private investment returns and Public Market Equivalent (PME) metrics tend to diminish over longer timeframes, further highlighting the value of patience in performance evaluation.

Your PME benchmarking analysis builds on concepts presented in how to create a financial model for investors, which examines building robust financial projections that underpin fund valuation. This connection emphasizes the importance of aligning long-term performance data with accurate financial modeling for a comprehensive investment strategy.

How to Benchmark Private Investments Against Public Markets

Comparing private investments to public market returns requires a structured approach that accounts for the unique characteristics of each asset class. Private Market Equivalent (PME) methodologies provide a quantitative framework for this comparison, enabling investors to evaluate performance and set realistic expectations for returns.

Understanding PME Methodologies

PME tools simulate how private investment cash flows would perform if invested in public markets. Here are three widely used methodologies:

  • Modified PME (mPME): Developed by Cambridge Associates, mPME invests private capital calls into a public index and proportionally sells shares at distributions. This method avoids negative Net Asset Value (NAV) issues, ensuring a smoother comparison process

  • Kaplan-and-Schoar PME (K&S PME): This approach calculates a ratio of the future values of distributions and contributions using public index returns. A ratio above one indicates that private investments outperform public markets, while a ratio below one suggests underperformance.

  • Long-Nickels PME: This method invests actual private contributions into a public market index and takes distributions accordingly. It provides a straightforward way to measure how private cash flows would fare in public markets.

The Role of Public Market Premiums

Private investments typically require higher returns to justify their illiquidity and risk. A modest public market premium, often averaging around 3%, highlights this need. For example, assuming a 6% return in public markets, private investments would need to achieve a 9% return—a 50% increase—to remain competitive.

Enhancing Benchmarking Accuracy

To refine your benchmarking process, consider integrating tools that complement PME methodologies. For instance, a review of the best financial forecasting software for startups introduces solutions that enhance forecasting accuracy, a critical component of PME analysis. These tools can help you model cash flows and predict outcomes more effectively.

By combining PME methodologies with advanced forecasting techniques, investors can gain deeper insights into fund performance and make more informed decisions about private investments relative to public benchmarks.

Make Smarter Investment Choices with Manager Selection and Allocation Strategies

Identifying the right investment managers and allocating capital effectively can significantly impact portfolio performance. To select top-performing managers, focus on evaluating median performance metrics, which provide a balanced view of their consistency over time. Additionally, custom-weighted pooled benchmarks offer a tailored approach to assessing manager success against specific investment goals.

Efficient capital allocation methodologies are equally crucial. By analyzing historical data and aligning allocation strategies with market trends, investors can optimize returns while mitigating risks. These actionable insights empower investors to refine their decision-making processes, ensuring that both manager selection and allocation strategies contribute to maximum performance improvement.

See the Framework in Action: A Case Study

A real-world application of the PME benchmarking framework offers valuable insights into portfolio maturity and strategic decision-making. This case study highlights how patience and a long-term approach can drive meaningful results.

The analysis revealed that over 80% of the portfolio was allocated to funds that had been active for at least five years. This finding underscores the importance of allowing investments to mature over time, as older funds often demonstrate greater stability and potential for value creation. By focusing on portfolio maturity, the framework provided actionable data that informed improved decision-making, enabling stakeholders to optimize their strategies for sustained growth.

This example illustrates how the PME framework goes beyond theoretical models, delivering practical tools for evaluating portfolio performance and identifying areas for enhancement. The emphasis on long-term strategy not only strengthens portfolio resilience but also ensures alignment with overarching investment goals.

Discovering diverse perspectives can significantly enhance your understanding of private equity and venture capital benchmarks. To help you stay informed, we’ve curated a selection of external insights that delve into current challenges and trends shaping private investment performance.

For instance, the article on Tariff Impacts explores how tariffs influence private markets, offering a unique angle on global economic factors. Additionally, the US PE/VC Benchmark Commentary: First Half 2024 provides a detailed analysis of performance benchmarks. For visual learners, the Video Series simplifies private investing concepts, while the 2025 Outlook forecasts future trends in private equity and venture capital.

These resources offer valuable insights to broaden your perspective on evolving market dynamics.

Conclusion

A structured PME benchmarking approach is vital for evaluating long-term performance and ensuring quantitative analysis drives decision-making. By implementing the strategies discussed, businesses can gain clarity on their progress and identify areas for improvement. This method not only enhances transparency but also fosters confidence among stakeholders.

At Qubit Capital, we understand the importance of connecting with the right investors to support your growth journey. Our Investor Outreach service streamlines communication and engagement efforts, helping you build meaningful relationships with investors who align with your vision.

Take the next step toward achieving your goals—partner with us to simplify your investor outreach process and maximize your opportunities for success.

Key Takeaways

  • PME benchmarking connects private fund performance with public market returns
  • A long-term view is critical for accurately evaluating investment outcomes
  • Tools like mPME, K&S PME, and Long-Nickels offer structured benchmarking methods
  • Strong manager selection and allocation strategies are vital for maximizing returns
  • Case studies highlight the real-world value of applying PME frameworks
Categories
Financial Modeling

TVPI vs DPI: Interpreting Private Equity Return Metrics

Private equity investors rely on precise metrics to evaluate fund performance, and TVPI (Total Value to Paid-In) is one of the most critical benchmarks. Alongside DPI (Distributions to Paid-In) and RVPI (Residual Value to Paid-In), these metrics offer a comprehensive view of a fund’s profitability and potential. Understanding how TVPI measures the total value generated by a fund, including both distributed and unrealized returns, is essential for assessing long-term investment success.

A nuanced evaluation of technological solutions is mirrored in best financial forecasting software for startups, which contributes insights on software selection that complement your modeling techniques.

This blog will explore TVPI, DPI, and RVPI in detail, comparing them to other metrics like IRR and MOIC to help investors make informed decisions. Let’s jump right in!

Breaking Down TVPI, DPI, and RVPI: What They Mean for You

Total Value to Paid-In (TVPI) is a comprehensive metric that divides the overall value of investments by the capital contributed by investors. It provides a high-level snapshot of a fund’s performance, combining realized and unrealized returns into a single figure.

TVPI: A Holistic View of Fund Performance

TVPI is often expressed as the sum of two components: DPI (Distributed to Paid-In) and RVPI (Residual Value to Paid-In). DPI measures realized returns, reflecting the portion of capital already distributed back to investors. On the other hand, RVPI captures unrealized potential, representing the remaining value of investments still held by the fund. Together, these metrics offer a balanced perspective on both past performance and future potential.

For example, a TVPI of 1.0x indicates that every dollar invested returns exactly one dollar, marking the break-even point. Research shows that the median TVPI for VC funds raised between 2018 and 2020 is 1.8x, while the median DPI stands at 0.4x. These figures highlight the industry benchmarks, helping investors compare their fund’s performance to broader norms.

Why TVPI Matters

TVPI is particularly valuable because it consolidates realized and unrealized returns into a single metric. This makes it easier for investors to assess the overall health and trajectory of a fund. While DPI provides reassurance about tangible returns, RVPI offers insight into the growth potential of remaining investments.

For a deeper dive into TVPI fundamentals, consider referencing BIP Source, which explains how TVPI, DPI, and IRR interact to inform private capital decisions.

Industry Benchmarks

Comparing your fund’s performance against industry benchmarks is crucial. The median TVPI/DPI values for VC funds raised between 2018 and 2020—1.8x and 0.4x, respectively—serve as useful reference points. These metrics can help investors gauge whether their fund is performing above or below average.

Understanding these metrics is just one step in building a strong investment case. For foundational perspectives on creating robust financial projections, explore how to create a financial model for investors.

How Realized and Unrealized Returns Impact Private Equity

Private equity fund performance is often evaluated using three key metrics: TVPI, DPI, and RVPI. Together, these metrics offer a comprehensive view of a fund’s realized achievements and its unrealized potential. Understanding their interplay is crucial for assessing both past successes and future opportunities.

TVPI: The Complete Picture

Total Value to Paid-In (TVPI) measures the overall performance of a fund by combining realized returns (capital already distributed) and unrealized returns (remaining portfolio value). For example, a fund with realized and unrealized components summing to Overall 2x demonstrates how these elements collectively reflect aggregate performance. TVPI is particularly useful for gauging the fund’s total value, regardless of whether the returns have been distributed or are still tied up in investments.

DPI: Realized Returns

Distributed to Paid-In (DPI) focuses solely on the capital that has been returned to investors. This metric is a clear indicator of tangible success, showing how much liquidity has been generated. However, DPI alone can be misleading if unrealized returns are substantial but remain unaccounted for. A case study like WeWork’s TVPI/DPI Disparity highlights this gap. Despite high paper valuations, WeWork’s DPI remained near zero due to limited liquidity events, while TVPI dropped from 2.1x to 0.7x after restructuring and asset sales.

RVPI: Future Potential

Residual Value to Paid-In (RVPI) captures the unrealized portion of a fund’s returns, representing the remaining value in the portfolio. This metric is essential for forecasting future outcomes, as it highlights the potential for additional gains. Balancing RVPI with DPI ensures that investors can assess both the fund’s historical performance and its future prospects.

A Balanced Approach

Analyzing TVPI, DPI, and RVPI holistically provides a nuanced understanding of private equity fund performance. While DPI emphasizes realized returns, RVPI sheds light on unrealized potential, and TVPI ties them together for a complete view. This balanced perspective is key to making informed decisions about past achievements and future opportunities.

TVPI vs. IRR vs. MOIC: How to Master Fund Evaluation

Fund performance requires a nuanced approach, especially when comparing metrics like TVPI, IRR, and MOIC. Each metric offers unique insights into investment growth and returns, but their differences can significantly impact how results are interpreted.

TVPI: A Comprehensive Snapshot of Fund Value

Total Value to Paid-In (TVPI) is a metric that evaluates the overall performance of a fund by combining distributed and unrealized returns. It provides a holistic view of how much value has been generated relative to the capital invested. Unlike IRR, which focuses on the time value of money, TVPI emphasizes the total return, making it particularly useful for assessing long-term fund performance.

IRR: Measuring Growth Over Time

Internal Rate of Return (IRR) calculates the annualized growth rate of investments, factoring in the timing of cash flows. While IRR is a powerful benchmark for comparing fund performance, its complexity can sometimes lead to manipulation. For instance, funds with early distributions may appear to outperform others, even if their overall returns are lower. This makes IRR a valuable but potentially misleading metric when used in isolation.

MOIC: A Straightforward Multiple on Capital

Multiple on Invested Capital (MOIC) is similar to TVPI but uses the initial investment as the denominator. This metric is particularly insightful during early-stage evaluations, as it highlights the multiple of capital generated without considering the timing of cash flows. Over time, MOIC and TVPI tend to converge as funds mature, offering complementary perspectives on performance. To better understand how MOIC relates to other metrics like ROIC and TVPI, you can draw a parallel using Finance Stu.

Key Differences and Practical Applications

While TVPI provides a broad view of fund value, IRR focuses on growth rates, and MOIC emphasizes capital multiples. Investors should use these metrics in combination to avoid pitfalls in interpretation. For example, relying solely on IRR might overlook the total value generated, while focusing exclusively on MOIC could ignore the timing of returns.

How to Steer Clear of Pitfalls in PE Metrics Evaluation

Limited data availability, coupled with storage and compute resource constraints, complicates the process of gathering reliable metrics. These issues are further exacerbated by the risks of overstating unrealized investments and selective reporting practices, which can skew the perception of a fund’s success.

Common Challenges in PE Metrics Evaluation

  • Data Availability and Reliability
    Accessing comprehensive and accurate data is a persistent hurdle in PE metrics evaluation. Firms often face difficulties in securing reliable datasets due to fragmented reporting systems and inconsistent data collection protocols. Addressing Operational Challenges by implementing rigorous data collection protocols can help mitigate these issues.

  • Overstatement of Unrealized Investments
    Unrealized investments are prone to overvaluation, especially when fund managers rely on optimistic projections. This can inflate metrics like Total Value to Paid-In (TVPI), creating a misleading picture of fund performance. A detailed discussion of risk considerations is paralleled by the insights in how to perform scenario analysis in financial modeling, providing context that enhances your understanding of uncertainty in models.

  • Selective Reporting Practices
    Selective reporting, where only favorable metrics are highlighted, undermines transparency. This practice can obscure the true performance of a fund, making it difficult for investors to make informed decisions.

The Importance of Standardized Benchmarks

Benchmarking PE metrics is complicated by the diversity of strategies and reliance on self-reported data. Without standardized benchmarks, peer comparisons become unreliable, leading to volatile performance evaluations. Consulting the Unigestion Report provides deeper insights into performance benchmarking difficulties.

Mitigating Pitfalls with Rigorous Protocols

To steer clear of these pitfalls, firms must adopt rigorous data collection protocols and standardized benchmarks. Additionally, stress testing models can ensure resilience under varied scenarios. A balanced outlook on model durability is offered in how to stress test financial models, presenting methods that highlight considerations of resilience under extreme conditions.

Use Advanced Data Tools to Strengthen Your Private Equity Analysis

Modern software solutions have revolutionized how investors evaluate critical metrics such as TVPI (Total Value to Paid-In), DPI (Distributions to Paid-In), RVPI (Residual Value to Paid-In), IRR (Internal Rate of Return), and MOIC (Multiple on Invested Capital). By centralizing these calculations, advanced tools not only save time but also ensure precision in decision-making.

Streamline Metrics with Specialized Software

Specialized software platforms, like those provided by [Allvue PE], simplify the complexities of private equity analysis. These tools consolidate key performance indicators into a single, user-friendly interface, allowing investors to compare fund performance seamlessly. For instance, [Allvue PE] offers robust capabilities for accurate reporting and real-time insights, ensuring that data discrepancies are minimized and actionable intelligence is readily available.

Moreover, these platforms are designed to handle the intricacies of PE metrics. Whether it’s calculating IRR to measure fund profitability or analyzing RVPI to assess unrealized value, advanced tools automate these processes, reducing the risk of human error. This level of precision is invaluable for investors aiming to make data-driven decisions.

Real-Time Insights for Better Decision-Making

The ability to access real-time data is a game-changer in private equity analysis. With modern software, investors can monitor fund performance as it evolves, enabling them to respond swiftly to market changes. This dynamic approach enhances the accuracy of PE assessment and fosters a deeper understanding of portfolio performance.

Enhance Your Analysis with Complementary Tools

Incorporating advanced data tools into your workflow doesn’t stop at private equity software. Broader innovations, such as [ai financial modeling tools], also play a crucial role in refining financial analysis. These AI-driven solutions automate complex calculations, offering a contemporary perspective that aligns with the demands of modern investors.

Conclusion

Understanding and comparing TVPI, DPI, and RVPI is essential for making informed investment decisions. These metrics provide a comprehensive view of fund performance, helping investors evaluate returns and identify opportunities for growth. Integrating robust data analysis into your strategy ensures that you avoid common pitfalls, such as misinterpreting metrics or relying on incomplete data.

We encourage you to apply these insights to refine your investment strategies and achieve better outcomes. Whether you’re assessing fund performance or planning your next move, these tools can guide you toward smarter financial decisions.

If you’re ready to refine your investment strategy and connect with the right financial partners, we at Qubit Capital can help through our Investor Discovery and Mapping service. Let’s turn insights into action today!

Key Takeaways

  • TVPI, DPI, and RVPI together provide a holistic view of fund performance by combining realized and potential returns
  • Comparing TVPI with IRR and MOIC offers richer insights into growth rates and investment multiples
  • Data limitations and selective reporting can affect the reliability of private equity metrics
  • Advanced data tools and software improve accuracy in performance evaluations
  • Qubit Capital’s specialized services support investors in finding the right opportunities and solutions
Categories
Financial Modeling

MOIC in Private Equity: Calculate & Benchmark Investment Multiples

Investment multiples play a pivotal role in evaluating private equity performance, and MOIC (Multiple on Invested Capital) stands out as a key metric. This calculation provides a clear snapshot of the total return generated relative to the initial investment, offering investors a straightforward way to assess profitability. Understanding MOIC is essential for benchmarking investments against industry standards and identifying opportunities for optimization.

Your exploration of MOIC computations connects with broader financial planning principles detailed in how to create a financial model for investors, offering a foundational backdrop for robust projection analysis. By integrating MOIC into financial modeling strategies, investors can gain deeper insights into their portfolio’s performance and make informed decisions to maximize returns.

Create Investment Strategies That Fit Your Fund’s Lifecycle

Tailored investment strategies are essential for aligning with the unique dynamics of a fund’s lifecycle. By incorporating purpose-built approaches, fund managers can optimize decision-making at every stage, from inception to maturity. A key component of this process is the use of advanced financial modeling tools to analyze investment multiples, enabling a deeper understanding of private equity performance.

Modern software solutions provide fund managers with the ability to forecast outcomes and evaluate performance metrics with precision. For example, integrating tools for financial forecasting can enhance the analysis of investment multiples, as highlighted in the best financial forecasting software for startups. These tools offer practical insights into software capabilities, ensuring strategies are not only data-driven but also adaptable to market shifts.

For fund managers seeking to refine their strategies, understanding the interplay between lifecycle dynamics and advanced modeling tools is crucial. It’s not just about tracking metrics—it’s about creating strategies that drive measurable results.

How is MOIC Calculated?

MOIC is calculated by dividing the total value of an investment (including realized and unrealized gains) by the total capital invested. For example, if an investor puts $1 million into a fund and later receives $3 million in total value, the MOIC would be 3x. This simplicity makes it a preferred metric for assessing the overall profitability of private equity investments.

What sets MOIC apart is its ability to offer a comprehensive view of performance, regardless of the investment’s timeline. Unlike metrics such as Internal Rate of Return (IRR), which factor in time, MOIC focuses purely on the multiple achieved. This makes it particularly useful for comparing investments across different funds or strategies.

How to Calculate MOIC Step by Step

Mastering the calculation of MOIC (Multiple on Invested Capital) begins with understanding its straightforward formula:

MOIC = Total Value ÷ Invested Capital

This metric evaluates the total return on an investment, combining both realized and unrealized gains. Let’s break this down into actionable steps with a practical example.

Step 1: Identify the Invested Capital

Start by determining the initial amount invested. For instance, if you invested $10 million in a project, this becomes your Invested Capital.

Step 2: Calculate Total Value

The Total Value includes all cash inflows, dividends, and unrealized gains. Suppose your investment generates $15 million in cash inflows and $10 million in unrealized gains. Adding these together gives a Total Value of $25 million.

Step 3: Apply the Formula

Divide the Total Value by the Invested Capital:
[
MOIC = \frac{\text{Total Value}}{\text{Invested Capital}} = \frac{25M}{10M} = 2.5x
]
This means your investment has grown 2.5 times its original value.

Practical Illustration

Consider an example scenario where a $10 million investment yields $15 million in dividends and unrealized gains. Using the formula, the MOIC is calculated as 2.5x, reflecting a strong return on investment.

Why MOIC Matters

MOIC provides a clear snapshot of investment performance, helping investors assess whether their capital is generating sufficient returns. For a deeper understanding of how different scenarios can impact MOIC calculations, explore insights on how to perform scenario analysis in financial modeling.

MOIC vs IRR: Which Metric Works Best for You?

MOIC (Multiple on Invested Capital) and IRR (Internal Rate of Return) serve distinct purposes, offering complementary insights into financial outcomes. While MOIC highlights the total capital multiples achieved, IRR incorporates the time value of money, providing a dynamic view of returns over time.

When to Use MOIC

MOIC is particularly useful for assessing the overall profitability of an investment. It answers the question: “How much capital was returned relative to what was invested?” This metric is straightforward and ideal for long-term investments where timing is less critical. For example, if an investor prioritizes maximizing total returns without focusing on the speed of those returns, MOIC becomes the go-to metric.

When IRR Takes the Lead

IRR shines in scenarios where timing plays a pivotal role. It calculates the annualized rate of return, factoring in the timing of cash flows. This makes it invaluable for comparing investments with varying durations or for projects where early returns are prioritized. IRR is particularly relevant for private equity funds aiming to optimize cash flow cycles and meet specific time-sensitive financial goals.

Complementary Insights

The SEC’s recent trend of mandating concurrent disclosure of MOIC and IRR in quarterly statements underscores their complementary nature. Together, these metrics provide a holistic view of investment performance, balancing profitability with efficiency. For those looking to automate the analysis of both metrics, modern ai financial modeling tools can streamline projections and enhance decision-making accuracy.

MOIC Pros and Cons You Need to Know

MOIC, or Multiple on Invested Capital, is a widely used metric in private equity for evaluating performance. Its simplicity and versatility make it an attractive choice for investors seeking a quick snapshot of value generation. By comparing the total value of an investment to the initial capital deployed, MOIC provides a clear indication of how much value has been created. This straightforward calculation is particularly useful for benchmarking across portfolios or assessing the success of individual investments.

However, MOIC has its limitations. One major drawback is its exclusion of time and risk factors. While it shows the multiple of capital returned, it does not account for the duration of the investment or the risks involved in achieving those returns. For instance, an investment yielding a high MOIC over ten years may not be as favorable as one with a slightly lower MOIC achieved in five years. Additionally, MOIC does not reflect the resilience of financial models under varying scenarios. To address this, pairing MOIC with robust resilience checks, such as understanding how to stress test financial models, can provide a more comprehensive view of performance.

Ultimately, MOIC is best used in conjunction with other metrics to ensure a balanced evaluation of investment outcomes.

How to Compare MOIC to Industry Benchmarks

Most private equity firms aim for a MOIC between 2.5x and 3.5x, which serves as a standard target range across the sector. These benchmarks help investors contextualize fund outcomes and assess whether returns meet or exceed industry norms.

Market conditions play a significant role in shaping MOIC expectations. For instance, during periods of economic expansion, higher multiples may be achievable due to increased deal flow and favorable valuations. Conversely, in downturns, achieving even the lower end of the benchmark range can be challenging.

For deeper insights into how MOIC varies across fund types, such as growth equity versus buyout funds, consult the HBS Report, which provides empirical data on private equity performance targets.

How MOIC Supports Smarter Investment Decisions

MOIC (Multiple on Invested Capital) plays a pivotal role in evaluating investment performance, especially when paired with time-sensitive metrics like IRR (Internal Rate of Return). While MOIC provides a clear snapshot of the total return on invested capital, IRR adds a temporal dimension, revealing how quickly those returns are realized. Together, these metrics empower investors to make informed decisions that balance long-term strategy with short-term opportunities.

A multi-metric approach strengthens investment strategies by offering a comprehensive view of performance. For instance, MOIC in private equity can highlight the overall profitability of a fund, while IRR can guide decisions on reinvestment timing or portfolio adjustments. This combination ensures that investors are not solely focused on absolute returns but also on the efficiency of capital deployment over time.

What Impacts MOIC? Key Factors to Watch

Multiple factors influence the Multiple on Invested Capital (MOIC), shaping private equity performance and overall investment outcomes. Understanding these elements can help investors optimize returns and mitigate risks.

1. Investment Performance

Stronger profits directly enhance MOIC. Investments that generate consistent revenue growth or achieve operational efficiencies tend to deliver higher returns, boosting the overall multiple.

2. Time Horizon

Extended holding periods often allow assets to appreciate in value, particularly in illiquid markets. For example, the SilverMountain Real Estate Portfolio achieved a 3.8x MOIC over seven years by balancing realized and unrealized value in illiquid assets.

3. Fees

Lower fees, including management and transaction costs, preserve capital and improve MOIC. Investors should carefully evaluate fee structures to avoid unnecessary erosion of returns.

4. Exit Strategy

Strategic exits, such as well-timed sales or IPOs, maximize realized value and contribute significantly to MOIC.

5. Market Conditions

Favorable market conditions, including economic growth and industry trends, amplify asset appreciation and enhance private equity performance.

Understanding these factors is crucial for optimizing investment strategies and achieving higher MOIC.

Top Software Tools for MOIC and IRR Analysis

Streamlining financial calculations has never been easier with advanced software tools designed to calculate MOIC and IRR efficiently. Cloud-based platforms like Allvue Systems simplify complex analyses, offering automation and real-time performance tracking across portfolios.

Automation not only enhances accuracy but also provides instant insights into portfolio metrics, ensuring decisions are data-driven and timely. Tools such as Allvue Systems excel in delivering real-time reporting, making them indispensable for modern investment management.

By integrating automation into financial workflows, these tools reduce manual errors and save valuable time, allowing professionals to focus on strategic growth. Whether you’re managing a single investment or an extensive portfolio, these solutions ensure precision and scalability in financial analysis.

Conclusion

Understanding MOIC in Private Equity is essential for evaluating investment performance. This metric simplifies the process of assessing returns by focusing on the multiple of invested capital, offering a straightforward view of profitability. While MOIC provides clarity, comparing it with IRR highlights the importance of considering time value and cash flow timing. Investors benefit from benchmarking MOIC against industry standards to ensure competitive outcomes.

A multi-metric approach, combining MOIC with IRR and other financial indicators, empowers investors to make well-rounded decisions. This strategy minimizes risks and enhances the ability to identify high-potential opportunities.

If you’re looking to enhance your investment communications , we at Qubit Capital can help you with our Fundraising Assistance Services. Get in touch with us to and make a lasting impression, telling investors you know the numbers.

Key Takeaways

  • MOIC is essential for assessing returns in relation to capital invested
  • Defined calculation steps and benchmark ranges offer actionable guidance
  • Using MOIC alongside IRR strengthens performance evaluation
  • Customized strategies and advanced tools help refine investment decisions
  • Recognizing key influencing factors is critical to maximizing returns
Categories
Financial Modeling

DCF Analysis Explained: Valuing Your Startup’s Future Cash Flows

Understanding the value of your startup often begins with projecting its future financial potential. Discounted Cash Flow (DCF) analysis is a widely used method for estimating the intrinsic value of a business by analyzing its expected cash flows. This approach is particularly valuable for startups, where future growth and profitability are key considerations. By calculating the present value of projected earnings, DCF analysis helps founders and investors make informed decisions about funding, scaling, or even exiting the business.

Accurate financial forecasting is essential for building reliable DCF models. A review of the best financial forecasting software for startups complements the analysis by framing the technological support behind precise cash flow projections.

Let’s dive deeper into how DCF analysis can unlock insights into your startup’s future potential.

What You Need to Know About Discounted Cash Flow

Discounted Cash Flow (DCF) analysis is a cornerstone of financial valuation, offering a structured approach to determining the intrinsic value of an investment or business. By projecting future cash flows and discounting them to their present value, DCF analysis helps investors and decision-makers assess whether an asset is undervalued or overvalued. This method is widely used in investment decision-making, capital budgeting, and startup valuation, making it indispensable for financial planning.

The Formula and Key Assumptions

At its core, DCF analysis relies on the formula:

DCF = Σ (Cash Flow / (1 + Discount Rate)^t)

Here, cash flow represents the projected earnings, the discount rate accounts for risk and time value of money, and “t” denotes the time period.

Accurate forecasting is critical, as assumptions about revenue growth, expenses, and market conditions directly impact the valuation outcome. Long-term projections, often spanning five to ten years, are essential for capturing the full potential of a business or investment.

Expert Insights: Looking Beyond Market Noise

Parth Sanghvi, a financial expert, emphasizes the importance of focusing on fundamentals rather than short-term market fluctuations.

He advises investors to prioritize sustainable growth metrics and realistic assumptions over reacting to external noise. This perspective aligns with the DCF methodology, which values long-term stability over transient trends.

Why DCF Matters for Startups

For startups, DCF analysis plays a pivotal role in attracting investors and securing funding. It provides a clear picture of future profitability based on current strategies and market conditions. Your exploration of DCF analysis is enriched by insights from how to create a financial model for investors, which sets a foundational perspective on startup valuation.

How to Approach Discounted Cash Flow Calculations

Discounted Cash Flow (DCF) analysis is a cornerstone of financial modeling, offering a structured approach to valuing investments based on projected cash flows. This section outlines the essential steps to conduct a DCF analysis, ensuring accuracy and depth in your financial evaluations.

Step 1: Forecasting Unlevered Free Cash Flow

The first step in DCF analysis involves estimating unlevered free cash flow (UFCF), which represents the cash generated by a business before accounting for debt and interest payments. Begin by analyzing historical financial data to identify trends in revenue, operating expenses, and capital expenditures. Use these insights to project future cash flows over a defined forecast period, typically 5–10 years.

Key considerations include:

  • Revenue Growth Assumptions: Base projections on realistic market conditions and historical performance.
  • Operating Costs: Factor in inflation and efficiency improvements to refine expense estimates.
  • Capital Expenditures: Account for necessary investments in assets to sustain operations.

Step 2: Calculating Present Value

Once UFCF is forecasted, the next step is to discount these cash flows to their present value using a discount rate. This process adjusts future cash flows for the time value of money, reflecting the principle that money today is worth more than the same amount in the future.

The formula for present value is:

  • [ PV = \frac{CF}{(1 + r)^t} ]
  • Where:
  • CF = Cash Flow
  • r = Discount Rate
  • t = Time Period

Step 3: Determining the Weighted Average Cost of Capital (WACC)

The discount rate used in DCF analysis is typically the Weighted Average Cost of Capital (WACC). WACC represents the average rate of return required by equity and debt investors, weighted by their respective proportions in the capital structure.

To calculate WACC:
1. Cost of Equity: Use models like the Capital Asset Pricing Model (CAPM), which incorporates risk-free rates, market risk premiums, and beta values.
2. Cost of Debt: Account for the interest rate on existing debt, adjusted for tax benefits.
3. Weighting: Combine equity and debt costs based on their relative contributions to total capital.

Step 4: Estimating Terminal Value

Terminal value captures the value of cash flows beyond the forecast period, ensuring the model reflects the long-term potential of the investment. There are two common methods for calculating terminal value:

  • Perpetuity Growth Model: Assumes cash flows grow at a constant rate indefinitely.
    [ TV = \frac{CF_{n} \times (1 + g)}{r – g} ]
    Where:
  • CFₙ = Final Year Cash Flow
  • g = Growth Rate
  • r = Discount Rate

  • Exit Multiple Method: Applies a valuation multiple to the final year’s EBITDA or revenue

When modeling terminal value, it’s crucial to apply the Terminal Growth Constraint, which recommends keeping growth rates below long-term GDP growth to avoid unrealistic projections.

Step 5: Conducting Sensitivity Analysis

DCF models are inherently sensitive to assumptions, making scenario-based sensitivity analysis a vital step. Adjust variables such as revenue growth, WACC, and terminal growth rates to evaluate how changes impact valuation outcomes. This approach highlights risks and ensures robust decision-making.

Advanced Adjustments: Operating Leases Under IFRS 16

For businesses adhering to IFRS 16, operating leases must be treated as financial liabilities. This adjustment affects UFCF calculations and WACC, as lease payments are reclassified from operating expenses to financing costs. Incorporating these changes ensures compliance and enhances the accuracy of your DCF model.

Learn DCF with Examples and Step-by-Step Tutorials

This section dives into real-world applications, offering sample calculations, downloadable tools, and case studies to illustrate how DCF analysis adapts to different business scenarios.

Practical Examples of DCF Analysis

DCF analysis is versatile, accommodating various industries and growth models. For instance, the Walmart DCF Valuation highlights how assumptions can drastically shift valuation outcomes. In one model, Walmart’s valuation ranged from $46.49 to $97.43, depending on the input variables. This discrepancy underscores the importance of refining assumptions to achieve accurate results.

Similarly, high-growth companies like Uber and Snap present unique challenges for DCF analysis. Uber’s valuation, detailed in Uber Valuation, explores projections for ride-sharing markets with aggressive growth rates and evolving discount rates. On the other hand, Snap’s DCF model, showcased in Snap DCF, demonstrates how early-stage tech companies can still utilize DCF despite volatile user acquisition costs.

Tools to Simplify DCF Modeling

To streamline your DCF calculations, downloadable templates like the Walmart DCF Model provide a hands-on approach. This Excel file, uses historical data to model valuations for large retailers. Whether you’re analyzing dividend-focused companies or high-growth startups, such tools can save time and enhance accuracy.

Tutorials for Enhanced Understanding

Step-by-step tutorials are invaluable for mastering DCF analysis. For those interested in dividend-based methodologies, the Dividend Valuation guide explains how to adapt DCF for companies with stable dividend payouts.

By combining case studies, tools, and tutorials, this section equips you with the knowledge to tackle diverse valuation challenges confidently. Whether you’re analyzing established giants like Walmart or dynamic startups like Uber and Snap, DCF analysis remains a cornerstone of financial modeling.

Understand DCF: Critiques, Comparisons, and Its Limits

Discounted Cash Flow (DCF) analysis is widely regarded as a cornerstone of financial valuation, offering flexibility and broad applicability across industries. Its ability to project future cash flows and discount them to present value makes it indispensable for investors and analysts. However, this method is not without its challenges, particularly its sensitivity to assumptions and the inherent risks of forecast errors.

Strengths of DCF Analysis

One of the most compelling advantages of DCF analysis is its adaptability. It can be tailored to various industries and scenarios, making it a versatile tool for valuing businesses, projects, or investments. Additionally, DCF provides a structured approach to assessing intrinsic value, which is particularly useful for long-term decision-making.

Legal and practical acceptance further underscores its importance. For instance, in the iKang Healthcare DCF Weighting case, courts assigned a 90% weighting to DCF in valuation, demonstrating its credibility in judicial settings. This example highlights how DCF is often prioritized in industries where future cash flow projections are critical.

Weaknesses and Pitfalls

Despite its strengths, DCF analysis is highly dependent on the accuracy of its inputs. Small changes in assumptions—such as growth rates, discount rates, or terminal values—can lead to significant variations in outcomes. This sensitivity makes it vulnerable to errors, especially when forecasting uncertain future cash flows.

Moreover, DCF assumes a level of predictability that may not exist in volatile markets or industries. To mitigate this, incorporating scenario analysis can help address uncertainties. Observations on how to perform scenario analysis in financial modeling add context to the variability of future cash flows in your DCF evaluation, ensuring a more robust approach.

Real-World Implications

The iKang Healthcare example illustrates both the strengths and limitations of DCF. While its high weighting in court valuations underscores its reliability, it also highlights the risks of over-reliance on assumptions. In this case, the valuation was heavily influenced by projected cash flows, which could be subject to unforeseen changes.

Expand Your Knowledge with Research and Tools

Staying ahead in DCF analysis requires a commitment to innovation and continuous learning. This section brings together advanced research findings, cutting-edge forecasting techniques, and supplementary guides to enhance your financial modeling expertise. Emerging trends, such as AI-enhanced DCF modeling, are revolutionizing cash flow forecasting by integrating machine learning algorithms. These advancements have been shown to reduce projection errors by 18–25%, offering a more precise approach to valuation.

To explore how automation complements traditional methodologies, consider the inclusion of ai financial modeling tools, which streamline data analysis and improve predictive accuracy. Additionally, refining your models through scenario exploration is essential.

Conclusion

Accurate forecasting and the integration of advanced techniques in Discounted Cash Flow (DCF) analysis are essential for making informed financial decisions. Throughout this blog, we’ve explored key strategies that enhance the precision of DCF models, ensuring they reflect realistic assumptions and deliver actionable insights.

By applying these methods, you can elevate your financial modeling practices, whether you’re valuing a startup or assessing investment opportunities. The importance of refining your approach cannot be overstated, as it directly impacts the reliability of your valuations and the confidence of stakeholders.

If you’re seeking expert guidance to optimize your financial strategies or need assistance with fundraising, we’re here to help. Explore our fundraising assistance services to take your valuation and capital-raising efforts to the next level.

Key Takeaways

  • DCF analysis is essential for estimating a startup’s long-term value
  • Reliable cash flow forecasts and appropriate discount rates are key to accuracy
  • Advanced methods like scenario analysis and AI-driven forecasting improve precision
  • Including operating leases under IFRS 16 ensures realistic financial modeling
  • Case studies and tools support the practical use of DCF analysis
Categories
Financial Modeling

How to Calculate MOIC: Evaluating Your Investment Multiple

One metric that stands out in this evaluation is the Multiple on Invested Capital (MOIC). MOIC provides a clear snapshot of how much value an investment has generated relative to the initial capital deployed. Whether you’re assessing the performance of a private equity fund or analyzing venture capital returns, MOIC serves as a straightforward yet powerful tool.

Embedded within the broader guidance on financial modeling, how to create a financial model for investors outlines foundational elements that support your evaluation of investment multiples. This article will explore the definition of MOIC, its calculation process, real-world applications, and how it compares to other metrics like IRR. Let’s jump right in!

Your Guide to MOIC and How It’s Measured

MOIC, or Multiple on Invested Capital, is a fundamental metric for evaluating investment performance. It calculates the return on capital by comparing the total value of an investment—both realized and unrealized—to the original amount invested. This straightforward formula makes MOIC a versatile tool for assessing outcomes across various sectors, particularly in private equity and venture capital.

In private equity, MOIC serves as a benchmark for gauging fund success. Investors often aim for a MOIC of 2.0x or higher, which indicates that the investment has doubled its original value. According to IBanking Advice, funds with a MOIC exceeding 3.0x are considered exceptional performers. Venture capital firms also rely heavily on MOIC, especially for early-stage investments like Seed or Series A rounds. These smaller capital bases often yield higher median MOICs, as noted in recent trends since 2018.

Standardized methodologies for calculating MOIC have gained traction, particularly with the introduction of new SEC requirements for quarterly performance statements in 2024. These updates ensure consistency in reporting, making it easier for investors to compare opportunities across markets.

For those looking to refine their MOIC calculations, tools like the best financial forecasting software for startups can project potential exit values with precision.

How to Calculate MOIC: A Step-by-Step Guide with Examples

MOIC is a straightforward metric that compares the current or exit value of an investment to the initial capital invested. This section provides a clear, step-by-step guide to the calculation process, supported by real-world examples to make the concept actionable.

Step-by-Step Guide to Calculating MOIC

  • Identify the Initial Capital Invested
    Begin by determining the amount of money initially invested in the project or company. This figure serves as the baseline for the calculation.

  • Determine the Current or Exit Value
    Next, assess the current value of the investment or its exit value if the investment has been sold or liquidated. This could include proceeds from a sale, dividends, or other returns

  • Apply the MOIC Formula
    Use the formula:
    MOIC = Current or Exit Value ÷ Initial Capital Invested
    This simple division provides the multiple, which reflects the overall return on the investment.

  • Interpret the Result
    A MOIC greater than 1 indicates a positive return, while a MOIC of less than 1 signals a loss.

Real-World Examples

Below are some examples, which you can look through to get a better understanding on how MOIC works:

Example 1: Startup Investment

Imagine an investor puts $1 million into a startup. After several years, the startup is acquired for $5 million. Using the formula:
MOIC = $5,000,000 ÷ $1,000,000 = 5.0
This means the investor achieved a MOIC of 5.0, signifying a fivefold return on their initial investment.

Example 2: Private Equity Deal

Consider a private equity fund that invests $100 million in a company. After a holding period, the investment yields $140 million. The calculation is:
MOIC = $140,000,000 ÷ $100,000,000 = 1.4
Here, the MOIC of 1.4 reflects a 40% return on the original investment.

Example 3: Healthtech Startup Exit

A healthtech startup in the Marion Street Capital portfolio grows its revenue from $1 million to $10 million, achieving a strategic acquisition. This results in a MOIC of 7.5x, showcasing the impact of scaling and strategic planning.

Refining MOIC Calculations

To ensure accurate MOIC calculations, stress testing financial models can be invaluable. A discussion in how to stress test financial models offers an examination of techniques that can enhance your appraisal of financial model resilience. Stress testing allows investors to account for extreme market scenarios, ensuring their MOIC estimates remain robust.

Unrealized vs. Realized MOIC: How to Measure Returns Accurately

Acknowleding the nuances between unrealized MOIC and realized MOIC is essential for accurately evaluating investment performance. These metrics, while related, serve distinct purposes in assessing returns.

What Is Unrealized MOIC?

Unrealized MOIC, or Multiple on Invested Capital, represents the estimated value of an investment if it were liquidated at its current state. This metric is particularly useful for ongoing investments, offering a snapshot of potential returns based on current valuations. For example, if an investment initially worth $1 million is now valued at $2 million, the unrealized MOIC would be 2x. However, it’s important to note that unrealized MOIC is subject to market fluctuations and valuation assumptions, making it a less definitive measure.

How Does Realized MOIC Differ?

Realized MOIC, on the other hand, provides a concrete figure for returns after an investment has been exited. This metric captures the actual capital gained relative to the initial investment, offering a definitive assessment of performance. For instance, if an investment of $1 million is sold for $3 million, the realized MOIC would be 3x. Unlike its unrealized counterpart, realized MOIC is not influenced by market volatility or subjective valuations, making it a reliable indicator of success.

Both metrics are valuable, but understanding their differences ensures investors can interpret returns accurately. Unrealized MOIC highlights potential, while realized MOIC confirms outcomes. Balancing these insights is key to making informed decisions in investment strategies.

MOIC vs. IRR: Comparing Key Differences in Investment Metrics

Investment professionals often rely on metrics like MOIC and IRR to evaluate performance, but these tools serve distinct purposes. MOIC, or Multiple on Invested Capital, provides a straightforward measure of total returns by comparing the amount invested to the amount earned, without factoring in the timing of cash flows. This metric is ideal for assessing the overall profitability of an investment.

On the other hand, IRR, or Internal Rate of Return, incorporates the timing of cash flows to calculate an annualized rate of return. By considering when profits are realized, IRR offers a more dynamic perspective, especially for investments with uneven cash flow patterns. This makes IRR particularly useful for comparing projects with varying durations or payment schedules.

While MOIC highlights the magnitude of returns, IRR emphasizes efficiency and time value, making it a critical tool for investors focused on maximizing annualized performance. Understanding the interplay between these metrics can help investors tailor their strategies to align with their financial goals.

What Impacts MOIC Performance?

Multiple factors contribute to the performance of MOIC (Multiple on Invested Capital), shaping the ultimate returns for investors. Market conditions, for instance, play a pivotal role. Economic stability or volatility can directly influence asset valuations, affecting both entry and exit points. Similarly, investment duration is another critical element. Longer holding periods may allow assets to appreciate, but they also expose investments to prolonged market risks.

Fee structures, including management and performance fees, significantly impact MOIC calculations. High fees can erode returns, making it essential for investors to evaluate cost efficiency when assessing potential investments. Additionally, exit strategies are vital in determining MOIC outcomes. Whether through mergers, acquisitions, or public offerings, the timing and method of exit can substantially alter the realized returns.

MOIC Limitations You Should Know

MOIC (Multiple on Invested Capital) is a widely used metric, but it has its shortcomings that investors should carefully consider. One of its primary disadvantages is its inability to factor in the time value of money. By ignoring how long it takes to achieve returns, MOIC can paint an incomplete picture of an investment’s true performance. For instance, a higher MOIC might seem impressive, but if the returns take years to materialize, the actual value diminishes when compared to faster-yielding alternatives.

Another critical limitation is its lack of consideration for investment risks. Solely relying on MOIC can lead to overlooking short-term performance fluctuations and potential risks associated with the investment. This omission can result in decisions that prioritize long-term gains without adequately assessing the volatility or uncertainty involved.

How MOIC Can Shape Your Investment Strategy

MOIC, or Multiple on Invested Capital, serves as a powerful metric for refining investment decision-making across every stage of the investment cycle. Its consistent benchmarking capability allows investors to compare returns effectively, ensuring alignment with strategic goals.

Choosing Investments with Precision

MOIC offers clarity when evaluating potential opportunities. By comparing projected returns across different investments, it becomes easier to identify those with the highest potential for growth while maintaining a balance between risk and reward. This data-driven approach ensures that decisions are grounded in measurable outcomes rather than speculation.

Assessing Risk and Performance

Risk assessment is integral to any investment strategy, and MOIC plays a pivotal role in this process. It helps investors weigh the potential rewards against the inherent risks, enabling smarter allocation of resources. Additionally, MOIC provides a reliable framework for evaluating the performance of existing investments, ensuring they continue to meet expectations.

Attracting Investors and Allocating Resources

For fund managers, MOIC can be instrumental in attracting investors. A strong MOIC track record demonstrates the ability to generate consistent returns, building trust and credibility. Moreover, it aids in resource allocation by highlighting which investments deserve additional capital based on their performance metrics.

Planning Exits and Building Portfolios

MOIC’s ability to provide actionable insights ensures that every decision, from entry to exit, is backed by robust data. This consistency not only enhances performance but also builds confidence in the investment process.

Exit strategies benefit significantly from MOIC analysis. By understanding the multiple achieved on invested capital, investors can time their exits to maximize returns. Furthermore, MOIC supports portfolio construction by identifying complementary investments that align with overall objectives.

Conclusion

Understanding and applying the strategies discussed in this blog can significantly enhance your investment decision-making process. By mastering the calculation and interpretation of MOIC, investors gain a clearer perspective on potential returns and risks, enabling more informed choices.

These insights are not just theoretical—they offer practical value for anyone looking to optimize their portfolio or evaluate opportunities with precision. Whether you’re assessing a startup or managing a diversified portfolio, the ability to calculate MOIC empowers you to make data-driven decisions that align with your financial goals.

We encourage you to integrate these methods into your own investment analyses. If you need expert assistance in creating a robust financial model tailored to your needs, explore our Financial Model Creation service. Let us help you build a foundation for smarter, more strategic investments.

Key Takeaways

  • MOIC is a key metric for evaluating the total return on invested capital
  • A step-by-step approach makes MOIC easy to calculate and apply
  • Distinguishing between realized and unrealized MOIC ensures accurate performance assessment
  • Comparing MOIC with IRR reveals the distinct value each metric provides
  • Strategic use of MOIC can inform better investment portfolio decisions
Categories
Financial Modeling

Zero Cash Date: How to Calculate and Plan for It

Understanding your startup’s financial runway is crucial for long-term success. The zero cash date, which marks the point when your business runs out of funds, is a critical metric for founders to monitor. This concept not only highlights the urgency of managing cash flow but also serves as a foundation for strategic planning. By accurately calculating this date, startups can proactively address funding gaps and avoid operational disruptions.

Your exploration of the zero cash date naturally connects with how to create a financial model for investors, where foundational strategies support a broader understanding of financial projections. This blog will guide you through actionable strategies, advanced tools, and real-world examples to help you plan effectively for your zero cash date.

How to Master Your Zero Cash Date and Runway Planning

Financial health of a startup begins with two critical metrics: the zero cash date and the runway. While these terms are often used interchangeably, they serve distinct purposes in financial planning. The runway represents the duration a startup can sustain operations before exhausting its funds, whereas the zero cash date pinpoints the exact day when the cash reserves will be depleted.

Accurate forecasting of these metrics is not just a financial exercise—it’s a survival strategy. Misjudging your runway can lead to unexpected cash shortfalls, forcing reactive decisions that may harm your business. To avoid this, startups must adopt dynamic projections that account for variable expenses, revenue fluctuations, and potential funding delays. Scenario planning, for instance, allows founders to simulate different financial outcomes and prepare for contingencies.

Strategic adjustments can also extend your runway effectively. For example, securing extra funding early can provide a financial cushion, reducing the risk of hitting the zero cash date prematurely. Cost optimization, renegotiating vendor contracts, or even delaying non-essential expenditures are additional ways to stretch your cash reserves.

Why Knowing Your Zero Cash Date Is Essential

Zero cash date is a cornerstone of effective financial management for startups. This critical metric pinpoints the exact moment your company will exhaust its cash reserves, enabling founders to make informed decisions about fundraising and operational adjustments.

Proactive planning around your zero cash date ensures that fundraising efforts are initiated well before financial strain impacts daily operations. By anticipating cash flow challenges, founders can avoid disruptions that might jeopardize growth or team morale. For instance, startups with disciplined financial forecasting, like Protara Therapeutics, have demonstrated how advanced budgeting can scale a company from a two-person operation to a NASDAQ-listed public entity in just two years.

Transparency in financial management also plays a pivotal role in building investor trust. When founders openly communicate their runway and financial strategies, they foster confidence among stakeholders, paving the way for smoother funding rounds. Moreover, startups with robust cash flow monitoring are twice as likely to be acquired compared to the average, as highlighted in this Acquisition Stat. This statistic underscores the connection between financial discipline and improved acquisition prospects.

To streamline the process of tracking your zero cash date, explore tools designed for precise forecasting. Click here to learn about the best financial forecasting software for startups, which can automate projections and enhance accuracy.

How to Calculate Your Zero Cash Date Step by Step

This section outlines a clear, step-by-step process to calculate when your cash reserves will run out, helping you make informed decisions to sustain your business.

Step 1: Determine Your Burn Rate

The first step in calculating your zero cash date is identifying your monthly burn rate. Burn rate refers to the amount of cash your business spends each month to cover operating expenses. For example, if your startup spends $83.3k monthly, as highlighted in this burn rate example, you can use this figure as a reference for your calculations.

To calculate your burn rate:
– Subtract your monthly revenue from your monthly expenses.
– If your expenses exceed revenue, the difference represents your burn rate.

Step 2: Compute an Average Burn Rate

Burn rates can fluctuate due to seasonal trends, unexpected costs, or revenue spikes. To ensure accuracy, calculate an average burn rate over different time frames:
Short-term averages (e.g., 3 months): These reflect recent cost fluctuations, such as increased marketing spend or one-time expenses.
Long-term averages (e.g., 6–12 months): These smooth out anomalies, providing a more stable view of your financial trajectory.

Step 3: Divide Cash Balance by Burn Rate

Once you’ve established your average burn rate, divide your current cash balance by this figure. The result is your zero cash date—the point at which your cash reserves will be depleted. For example, if your cash balance is $250k and your average monthly burn rate is $83.3k, your zero cash date would be approximately three months away.

Step 4: Incorporate Scenario Planning

Scenario planning is essential to account for unexpected expenses or revenue changes. Build multiple projections based on potential scenarios, such as:
– Increased costs due to scaling operations.
– Delayed revenue inflows from clients or customers.
– One-time expenses like equipment purchases or legal fees.

How to Avoid Running Out of Cash Too Soon

Running out of cash prematurely can spell disaster for any business, especially startups. Operating with a negative cash balance is not only impractical but also illegal, making it essential to maintain sufficient funds to cover critical obligations. These include taxes, severance packages, and other liabilities that could otherwise lead to legal complications or reputational damage.

Unexpected cash shortfalls can also erode investor confidence, which is often the lifeline for growing businesses. Investors may perceive financial instability as a lack of foresight or poor management, potentially jeopardizing future funding opportunities. Beyond investor relations, cash depletion can destabilize operations, forcing businesses to halt projects, delay payments, or even shut down entirely.

Proactive planning is key to avoiding these pitfalls. Running best- and worst-case financial projections, such as how to perform scenario analysis in financial modeling, can help businesses prepare for uncertainty and identify their “zero cash date.” This approach ensures that decision-makers are equipped to act before cash levels dip below viable thresholds.

Track Your Zero Cash Date Using Real-Time Tools

Keeping a close eye on your cash flow is essential for startups aiming to avoid unexpected financial hurdles. Modern tools like Zeni’s real-time dashboard simplify this process by providing automated insights into your cash burn rate and zero cash date. These dashboards offer startups the ability to monitor their financial health proactively, ensuring that critical decisions are made with accurate, up-to-date information.

Automation plays a pivotal role in preventing unanticipated cash run-outs. By delivering timely insights, these tools help founders identify potential shortfalls before they become critical issues. For businesses with fluctuating revenue streams, personalized CFO services further enhance this approach by tailoring budgets and setting alerts that align with unique financial patterns.

Ai financial modeling tools complement real-time dashboards, offering startups a comprehensive solution to predict and manage financial challenges effectively.

Conclusion

Effective financial planning is the cornerstone of business sustainability. By accurately calculating your zero cash date and implementing strategies to extend your operational runway, you can position your business for long-term success. Proactive financial management not only helps you anticipate challenges but also ensures you’re prepared to seize growth opportunities as they arise.

If you’re seeking to secure the funding needed to extend your runway, we at Qubit Capital can support you through our Fundraising Assistance service. Let us help you take the next step toward achieving your business goals.

Key Takeaways

  • Understand the difference between zero cash date and runway for better financial planning
  • Determine the zero cash date by dividing current cash by monthly burn rate
  • Use proactive strategies like cost control and funding plans to extend runway
  • Real-time tools such as Zeni improve cash flow monitoring
  • Maintain financial stability through clear communication with investors
Categories
Financial Modeling

Internal Rate of Return (IRR): Measuring Investment Performance

The internal rate of return (IRR) serves as a powerful metric to evaluate the profitability of potential investments. By calculating the rate at which cash inflows equal outflows, IRR provides a clear picture of an investment’s efficiency over time. This metric is particularly valuable for comparing projects with varying scales or timelines.

The discussion of IRR naturally connects to how to create a financial model for investors, establishing a comprehensive context for reviewing financial projections. This overarching framework helps you appreciate the foundation of investment performance analysis.

Let’s dive deeper into the fundamentals of IRR and explore actionable insights that can elevate your investment strategies.

What Is the Internal Rate of Return (IRR) and Why Does It Matter?

The internal rate of return (IRR) is a powerful financial metric that plays a pivotal role in evaluating investment opportunities, particularly in commercial real estate finance and private equity. At its core, IRR represents the percentage rate earned on each dollar invested for every period it remains in play. This makes it an indispensable tool for investors seeking to measure the profitability of projects over time.

Understanding IRR and the Time Value of Money

One of the defining features of IRR is its reliance on the time value of money (TVM). This principle acknowledges that a dollar today is worth more than a dollar received in the future due to its earning potential. By incorporating TVM, IRR allows investors to assess the true value of cash flows generated by an investment, regardless of its size or duration.

For instance, a $7 million investment that grows to $21 million may have a higher IRR than a $70 million investment doubling to $140 million, as illustrated in the Sample Data. This highlights how IRR focuses on time-weighted returns rather than absolute gains.

The Impact of Market Cycles on IRR

Market conditions significantly influence IRR performance, making it a dynamic metric. For example, private equity IRRs dropped from 5.7% in 2023 to 3.8% in 2024, reflecting the sensitivity of returns to economic shifts. Similarly, venture capital funds experienced a decline in median IRR from 16.8% in 2021 to 12.0% in 2024, underscoring how external factors like market slowdowns can affect investment outcomes. These fluctuations emphasize the importance of considering broader economic trends when interpreting IRR figures.

Why IRR Is a Valuable Comparison Tool

IRR’s ability to standardize returns across investments of varying sizes and durations makes it an invaluable metric for decision-making. Unlike other measures, such as net present value (NPV), IRR provides a percentage-based evaluation, enabling investors to compare projects on equal footing. However, combining IRR with NPV can further enhance decision-making accuracy, reducing flawed investment choices by 22%, as noted in the IRR-NPV hybrid analysis adoption.

For those looking to refine their financial forecasting strategies, exploring tools like the best financial forecasting software for startups can complement IRR analyses. These tools provide practical solutions for rigorous investment evaluations, ensuring a comprehensive approach to financial planning.

By understanding the nuances of IRR, investors can make more informed decisions, balancing profitability with risk and market conditions.

How to Use an IRR Calculator Like a Pro

Mastering the use of an IRR calculator can significantly enhance your ability to evaluate investment opportunities. Whether you’re assessing real estate ventures, infrastructure projects, or renewable energy investments, understanding the nuances of the internal rate of return (IRR) is crucial. This section explores the formula behind IRR, compares it with related metrics, and highlights its limitations. By the end, you’ll have actionable insights and step-by-step guidance to use an IRR calculator effectively.

Understanding the IRR Formula

At its core, the IRR is the discount rate that sets the net present value (NPV) of an investment’s cash flows to zero. The formula is expressed as:

NPV = Σ [Ct / (1 + IRR)^t] – C0 = 0

Where:
Ct = Cash inflow during period t
C0 = Initial investment
t = Time period

This formula helps investors determine the profitability of a project by calculating the rate at which the present value of future cash flows equals the initial investment. However, manually solving for IRR can be complex, which is why tools like the Internal Rate of Return Calculator are indispensable. By inputting projected cash flows, you can quickly generate IRR projections and compare the profitability of different investments.

Step-by-Step Guide to Using an IRR Calculator

  1. Gather Your Data: Compile all projected cash flows, including initial investment and expected inflows over the investment horizon.
  2. Input Cash Flows: Enter these values into the IRR calculator. For example, if you’re evaluating a real estate project, include acquisition costs, rental income, and eventual sale proceeds.
  3. Review the Output: The calculator will provide the IRR, which you can use to assess whether the investment meets your desired return threshold.
  4. Compare Alternatives: Use the IRR to evaluate multiple projects. For instance, a renewable energy project with a 17.08% IRR and a 6.6-year payback period, as detailed in this Solar Panel ROI Analysis, might outperform other options.

IRR vs. Modified IRR and Equity Multiple

While IRR is a powerful metric, it has limitations. For instance, it assumes that all interim cash flows are reinvested at the same rate as the IRR, which may not be realistic. This is where the Modified Internal Rate of Return (MIRR) comes into play. MIRR adjusts for reinvestment assumptions, providing a more conservative estimate of returns.

Similarly, the equity multiple offers a straightforward measure of total returns by dividing total cash inflows by the initial investment. Unlike IRR, it does not account for the time value of money, making it a complementary rather than a competing metric.

Limitations of IRR in Investment Analysis

Despite its widespread use, IRR has certain drawbacks:

  • Exclusion of Risk Factors: IRR does not account for the cost of capital or project-specific risks. For example, infrastructure projects with an 11-12% IRR forecast, as noted in this Infrastructure IRR Forecast, may appear attractive but require additional risk assessments.
  • Sensitivity to Exit Horizons: Varying exit timelines can complicate comparisons. A project with a shorter duration might have a higher IRR but lower overall returns.
  • Extended Durations: Research indicates that IRR may not fully capture the impact of long-term investments or reinvestment assumptions.

Real-World Application: Commercial Real Estate

In commercial real estate (CRE), IRR is often used alongside other metrics like cap rates. A 10 basis point increase in cap rates can lead to a 15 basis point IRR compression, as highlighted in the Cap rate-IRR convergence in CRE. This underscores the importance of updating property valuation methods to reflect market dynamics.

For a more automated approach, consider exploring ai financial modeling tools. These tools streamline IRR computations and enhance the accuracy of your projections, saving time and reducing errors.

Answers to Your Common IRR Calculator Questions

Below, are some common asked questions related to IRR calcution to help you make the most of this tool.

How Does an IRR Calculator Work?

An IRR calculator determines the internal rate of return (IRR) by analyzing cash flows over time. It identifies the discount rate at which the net present value (NPV) of all cash inflows and outflows equals zero. This calculation is essential for evaluating investment performance and comparing profitability across projects.

What Are the Benefits of Using an IRR Calculator?

IRR calculators offer several advantages:

  • Quick Decision-Making: They provide a clear percentage that simplifies comparisons between investment opportunities.
  • Comprehensive Analysis: By factoring in time value of money, they offer a more accurate assessment of long-term profitability.
  • Versatility: Useful across industries, from commercial real estate financing to corporate project evaluations.

Are There Any Drawbacks to IRR Calculators?

While IRR calculators are powerful tools, they have limitations:

  • Multiple IRRs: Certain cash flow patterns can produce more than one IRR, complicating decision-making.
  • No Risk Assessment: They don’t account for external risks or uncertainties, which can impact investment outcomes.

To address uncertainties in IRR evaluation, consider integrating how to perform scenario analysis in financial modeling. This approach adds a layer of risk assessment by simulating varying financial conditions.

What Types of IRR Calculators Are Available?

IRR calculators come in different formats:

  • Online Tools: Accessible and user-friendly, these calculators are ideal for quick computations.
  • Spreadsheet Functions: Programs like Excel offer IRR formulas for more detailed analysis.
  • Dedicated Software: Advanced financial modeling tools provide robust features for complex scenarios.

How Does IRR Relate to Commercial Real Estate Financing?

In commercial real estate, IRR is a critical metric for assessing the profitability of property investments. It helps investors evaluate projected cash flows, account for acquisition costs, and compare potential returns across properties.

Conclusion

Understanding the fundamentals of IRR, mastering the use of IRR calculators, and addressing common questions are essential steps for making informed investment decisions. Throughout this blog, we’ve emphasized the importance of combining IRR with other financial metrics to gain a comprehensive view of potential returns. By applying the actionable insights and real-world examples shared here, you can confidently evaluate investment opportunities and optimize your financial strategies.

If you’re looking for expert assistance in building robust financial projections tailored to your needs, we invite you to explore our Financial Model Creation service. Let us help you turn complex data into actionable insights for your business growth.

Key Takeaways

  • IRR is a key metric for evaluating both profitability and timing of investments
  • Understanding IRR fundamentals helps compare different investment opportunities
  • Proficiency with the IRR calculator, its formula, and limitations supports smarter decisions
  • Metrics like Modified IRR and Equity Multiple offer deeper insights into performance
  • Real-world examples and advanced modeling strengthen financial analysis
Categories
Financial Modeling

Event ROI: Measuring Your Event’s Return on Investment

The events industry has witnessed remarkable growth, expanding from $887 billion in 2020 to a projected $2.194 trillion by 2028. This surge underscores the importance of understanding Event ROI, a critical metric for evaluating the success of any event. As businesses increasingly invest in events to drive engagement and revenue, robust strategies for measuring ROI become essential to ensure these investments deliver tangible results.

According to a Verified Market Research report, this rapid growth reflects the expanding role of events in marketing and business development. To maximize returns, companies must integrate advanced financial modeling techniques into their planning processes.

Let’s explore how to measure Event ROI effectively and unlock the full potential of your event strategies.

What Is Event ROI and How Can You Measure Value and Costs?

Event ROI, or Return on Investment, represents the net gain achieved from hosting or participating in an event after accounting for its costs. It serves as a critical metric for assessing whether an event delivers tangible benefits relative to the resources invested.

Key value factors that contribute to Event ROI include revenue generation, lead acquisition, sponsorship opportunities, brand recognition, and attendee satisfaction. These elements collectively determine the success and impact of an event. On the other hand, cost factors such as travel, lodging, production expenses, labor, and opportunity costs can significantly influence the overall ROI calculation.

A review of the best financial forecasting software for startups provides a clear perspective on selecting the right tools to streamline your projections, including tracking event ROI effectively.

Why Event ROI Matters for Your Strategy

Measuring ROI not only justifies event budgets but also ensures that outcomes align with broader strategic goals. Without accurate ROI tracking, businesses risk overlooking cost-saving opportunities and making decisions based on incomplete data.

For instance, evaluating ROI can reveal whether an event’s expenses are translating into tangible benefits, such as increased sales or stronger client relationships.

How to Define Goals, Metrics, and Tools for Event ROI Success

Establishing clear event goals is the foundation for aligning activities with broader business outcomes. Whether your objective is lead generation, brand awareness, employee training, or revenue growth, measurable goals provide a roadmap for evaluating success. For example, tracking the number of qualified leads generated during an event directly ties to ROI metrics like conversion rates or revenue impact.

Precise measurement requires the right tools. Platforms like CRM systems, event management software, and analytics dashboards simplify tracking performance indicators such as attendee engagement, sales conversions, or social media reach. These tools not only streamline data collection but also ensure accuracy in ROI calculations.

The Best Models and Methods to Measure Event ROI

Understanding the effectiveness of an event requires precise ROI measurement techniques. From basic calculations to advanced attribution models, these methods ensure both tangible and intangible benefits are accounted for.

1. Return/Investment Model

This straightforward formula calculates ROI as (Revenue – Cost)/Cost, offering a clear snapshot of profitability. It’s ideal for events with direct revenue streams, such as ticket sales or product purchases.

2. Incremental Revenue Model

Designed to measure additional revenue generated beyond baseline projections, this model highlights the financial impact of an event. For example, if a product launch drives sales above average monthly figures, the difference is attributed to the event’s success.

3. Incremental Margin Model

To assess true profitability, this method subtracts event-specific expenses from the gross margin. It’s particularly useful for events with high operational costs, ensuring that net gains are accurately reflected.

4. Multi-Touch Attribution

This advanced approach credits multiple customer touchpoints, such as pre-event marketing campaigns and post-event follow-ups, for conversions. By distributing ROI across these interactions, businesses gain a nuanced understanding of how their event contributed to overall success.

5. CLTV Integration

Customer Lifetime Value (CLTV) integration emphasizes the long-term impact of an event. For instance, if attendees become repeat customers, their future purchases are factored into the ROI calculation, showcasing the event’s extended value.

6. Intangible ROI Metrics

Not all benefits are monetary. Metrics like brand equity, attendee satisfaction, and social media engagement provide insights into the intangible outcomes of an event. These factors often influence long-term growth and reputation.

Capture and Analyze Data to Improve Event ROI

Effective event ROI analysis begins with meticulous data collection, starting at registration and extending through live engagement tracking during the event. For instance, Bizzabo’s New Registration Experience case study demonstrated a 300% increase in web visitor-to-attendee conversion rates, showcasing how optimized registration processes can significantly impact ROI. This highlights the importance of capturing attendee data early and consistently.

Key Strategies for Data Collection and Analysis

  1. Pre-Event Data Capture
    Registration platforms are the first touchpoint for gathering attendee information. By integrating tools that streamline registration, such as those used in the Bizzabo case study, organizations can ensure higher conversion rates and richer datasets.

  2. Real-Time Engagement Tracking
    During the event, technologies like engagement apps and live polling tools provide actionable insights into attendee behavior. These tools not only enhance the experience but also offer valuable metrics for evaluating session popularity and interaction levels.

  3. Post-Event Feedback and Lead Qualification
    Surveys and CRM-integrated lead scoring systems are essential for gathering feedback and qualifying leads after the event. This data is crucial for calculating the final ROI and identifying areas for improvement.

Technology Integration for Holistic Insights

Integrated platforms that connect CRM systems, registration tools, and engagement technologies enable end-to-end event performance analysis. This seamless integration ensures that no data point is overlooked, providing a comprehensive view of ROI.

Use Event Technology to Track ROI Accurately

Modern event technology is transforming how businesses measure success. Advanced platforms seamlessly integrate data across pre-, during-, and post-event phases, ensuring every interaction is captured. These tools provide instant data connections, enabling organizers to track attendee engagement, session performance, and lead generation in real time.

Real-time analytics further enhance ROI tracking by delivering immediate feedback. This allows businesses to optimize event strategies on the spot, ensuring resources are allocated effectively. With precise data integration and actionable insights, calculating ROI becomes not only more accurate but also more comprehensive.

Which Attribution Models Work Best for Event Marketing?

Here are different attribution models specific marketing touchpoints, offering unique perspectives on performance

  • The First-touch Model prioritizes the initial interaction, giving full credit to the first point of contact with your audience. This approach highlights the importance of awareness campaigns but may overlook later efforts that drive conversions.
  • The Lead-touch Model focuses on the activity that captures the lead, emphasizing the touchpoint that turns interest into actionable intent. It’s ideal for identifying which channels generate the most qualified leads.
  • The Last-touch Model attributes all ROI to the final interaction before conversion. While this model underscores closing tactics, it can undervalue earlier stages of the buyer journey.
  • Lastly, the W-Shaped Model distributes credit across key touchpoints, offering balanced insights into the entire customer journey. This model is particularly useful for event marketers seeking a holistic view of campaign effectiveness.

Other Attribution Strategies to Improve Event ROI

Three noteworthy strategies include multi-touch variations, U-shaped attribution, and time-decay models. Here’s how they work.

  • Multi-touch variations: These models distribute credit across all touchpoints, offering a balanced view of how each interaction influences conversions.
  • U-shaped attribution: This approach emphasizes the first and last touchpoints, assigning higher value to the initial engagement and final conversion step.
  • Time-decay models: By prioritizing recent interactions, this strategy highlights the importance of touchpoints closer to the conversion event.

The Best Platforms and CRMs for Tracking Event ROI

Tracking event ROI requires tools that simplify data collection, analysis, and attribution. Marketing platforms like Marketo are invaluable for managing event registration and running targeted campaigns. With its automation features, Marketo enables businesses to nurture leads and attribute ROI more accurately.

CRMs such as Salesforce play a critical role in connecting event interactions to lead conversions and revenue. By integrating Salesforce campaigns, businesses can map closed-won deals back to specific event activities, ensuring a clear understanding of ROI.

Dedicated attribution platforms further enhance ROI tracking by clarifying complex buyer journeys. They provide visibility into touchpoints across the customer lifecycle, ensuring every interaction is accounted for.

Why Integrations Are Key to Better Event ROI

Effective integrations between platforms, CRMs, and analytics tools transform the way event ROI is calculated. By ensuring seamless data flow across systems, these integrations eliminate manual errors and improve the accuracy of ROI measurements. When data moves consistently between tools, it provides a reliable foundation for assessing event performance and identifying areas for improvement.

Seamless integrations also reduce the time spent on manual data handling, allowing teams to focus on strategic decisions rather than troubleshooting inconsistencies. With accurate and automated data synchronization, businesses can confidently measure the impact of their events and optimize future strategies.

How to Maximize ROI Across Different Event Types

Tailoring your approach to suit specific event formats can significantly enhance your return on investment (ROI). Whether you’re hosting trade shows, virtual events, conferences, or hybrid gatherings, each type demands unique strategies to optimize performance.

1. Trade Shows: Focus on Booth Design and Follow-Up

Trade shows thrive on visual appeal and targeted communication. An optimized booth design that captures attention is essential, paired with messaging that resonates with your audience.

Post-event follow-up is equally critical—trade show leads typically convert between 5% and 10%, with some companies reporting a 14% ROI. Highlighting key benchmarks, such as those shared by Trade Show Labs, can help set realistic performance goals.

2. Virtual Events: Prioritize Engagement Tools

Interactive elements like live polls, Q&A sessions, and breakout rooms are vital for driving virtual event ROI. These features keep attendees engaged and foster meaningful interactions, ensuring your event delivers measurable results.

3. Conferences: Deliver Value Through Content and Networking

High-quality sessions and networking opportunities are the backbone of successful conferences. Focus on curating content that addresses attendee pain points while facilitating connections that add tangible value.

4. Hybrid Events: Expand Reach and Data Capture

Hybrid events combine the best of in-person and virtual formats, offering broader audience reach and enhanced data collection. Use this dual approach to maximize attendee participation and gather actionable insights.

Use Advanced Software to Calculate Event ROI

Simplifying ROI calculations for events is now achievable with advanced software solutions. These tools integrate registration systems, CRM platforms, and analytics data into a unified framework, reducing the complexity of manual calculations while enhancing accuracy. By consolidating diverse data sources, such software delivers real-time insights that are actionable and tailored to your event goals.

With ROI software, event planners can make informed decisions faster, ensuring every aspect of their strategy aligns with measurable outcomes. This streamlined approach not only saves time but also provides a clear picture of the event’s financial success.

See the Bigger Picture: Event Value Beyond ROI Metrics

Events offer more than just measurable financial returns; they create intangible benefits that amplify long-term success. Beyond the immediate ROI, the true value of events lies in fostering stronger brand equity, cultivating customer loyalty, and opening doors to meaningful connections.

These intangible gains, such as enhanced customer relationships and networking opportunities, contribute significantly to a brand’s enduring strength. By focusing on these broader impacts, businesses can unlock the full potential of their event strategies, ensuring their efforts resonate far beyond the numbers.

Conclusion

Measuring event ROI effectively requires a blend of strategic planning and robust data analysis. By implementing the strategies and ROI measurement models discussed, businesses can gain deeper insights into their event performance and make informed decisions for future initiatives. Integrating technology and data analytics tools is essential for ensuring accuracy and uncovering actionable insights that drive growth.

We encourage you to apply the insights shared in this article to refine your approach to event ROI measurement. If you’re looking to enhance your financial strategies further, we at Qubit Capital offer tailored Financial Model Creation services. Let us help you unlock better outcomes and achieve your business goals.

Key Takeaways

  • Event ROI includes both measurable revenue and qualitative gains like brand equity
  • Setting clear goals and collecting data are vital for precise ROI evaluation
  • Different ROI models offer customized insights for various event formats
  • Advanced event tech and integrations improve tracking and data analysis
  • Recognizing both tangible and intangible outcomes supports sustained success
Categories
Financial Modeling

Startup Valuation Techniques: Methods and Best Practices

Startup valuation techniques provide a framework to assess a company’s worth, often in the absence of extensive financial history. These methods are not only essential for securing funding but also for setting realistic expectations in the market.

From financial forecasting to market comparisons, valuation involves multiple approaches tailored to the unique challenges startups face. Insights on best financial forecasting software for startups can play a pivotal role in refining these calculations, ensuring precision and reliability.

This blog aims to demystify startup valuation techniques, offering actionable insights and best practices to help you navigate this complex yet vital process.

Explore the Top Methods to Value Your Startup

Determining the value of a startup is both an art and a science, requiring a thoughtful combination of quantitative data and qualitative insights.

This section delves into key valuation approaches, including the Berkus Method, Comparable Transactions, Scorecard Valuation, and Discounted Cash Flow (DCF), offering actionable insights tailored to startups at various stages of growth.

1. The Berkus Method: Ideal for Pre-Revenue Startups

For early-stage startups without revenue, the Berkus Method provides a straightforward framework. Created by Dave Berkus, this approach assigns monetary values to specific risk-reducing milestones such as product development, market potential, and management team strength. According to the Berkus Cap, pre-revenue startups are typically valued at up to $2 million, while post-revenue startups may reach $2.5 million.

This method is particularly useful for founders seeking initial funding, as it emphasizes qualitative factors over financial metrics. For a deeper understanding, refer to Dave Berkus’s guide on the Berkus Method, which outlines its principles and practical applications.

2. Comparable Transactions: Benchmarking Against Industry Peers

Comparable Transactions rely on analyzing the valuation of similar companies within the same industry. By examining metrics like revenue multiples and transaction multiples, startups can estimate their worth based on real-world deal data. For example, Uber’s early valuation journey involved using comparable transactions to benchmark its growth potential and market position.

Revenue multiples are a common metric in this approach. Selecting the right multiples is essential for accurate comparisons, especially when factoring in industry-specific trends and market conditions.

3. Scorecard Valuation: Balancing Multiple Variables

The Scorecard Valuation Method, introduced by Bill Payne, is widely used for early-stage startups. This approach assigns weight to various factors, such as market size, competitive landscape, and the quality of the management team, to arrive at a comprehensive valuation.

Airbnb’s pre-IPO valuation framework is a prime example of this method in action. The company balanced numerous variables, including market potential and operational scalability, to refine its valuation strategy.

To learn more about the Scorecard Method, visit Bill Payne’s detailed explanation.

4. Discounted Cash Flow (DCF): Forecasting Future Value

The DCF method is ideal for startups with predictable cash flows. By projecting future earnings and discounting them to their present value, this approach provides a detailed financial picture. Key components include forecasting revenue growth, applying an appropriate discount rate, and accounting for startup-specific risks.

Combining Methods for Robust Valuation

While each valuation method has its strengths, combining multiple approaches often yields more reliable estimates. For instance, integrating the Berkus Method with Comparable Transactions can provide a balanced view of qualitative and quantitative factors. Similarly, using DCF alongside Scorecard Valuation ensures both future cash flows and current market dynamics are considered.

External Factors Impacting Valuation

Startup valuations are influenced by broader market trends and investor sentiment. For example, a downward shift in valuations across European markets has been observed, highlighting the importance of adjusting risk factors accordingly. Additionally, some startups are lowering SAFE note valuation caps to close early rounds more easily, reflecting changing dynamics in venture capital negotiations.

Bringing It All Together: Your Startup Valuation Summary

Startup valuation is rarely a one-size-fits-all process. By combining multiple valuation methods, founders can achieve a more accurate and reliable assessment of their business’s worth. This section underscores the importance of synthesizing diverse techniques, supported by robust data and analytical tools, to minimize risks and bridge estimation gaps effectively.

The Power of a Blended Approach

A single valuation method often falls short in capturing the full picture of a startup’s potential. For instance, while the Discounted Cash Flow (DCF) method focuses on future projections, it may overlook market trends or comparable benchmarks.

A blended approach—incorporating techniques like market comparables, DCF, and revenue multiples—ensures that each method compensates for the limitations of the others. This strategy not only improves accuracy but also provides a well-rounded perspective that investors and stakeholders can trust.

Data-Driven Comparisons

Access to extensive databases is a game-changer for startup valuation. Platforms like Crunchbase and AngelList collectively offer over 2 million data points, enabling founders to compare their startup against similar businesses in terms of funding rounds, market trends, and growth trajectories.

For example, Crunchbase helps you gather critical data on funding rounds and valuations, while AngelList allows you to discover comparable startups in your niche. These resources provide the foundation for comp-based valuation, ensuring that your estimates align with real-world benchmarks.

Refining Estimates with Analytical Tools

Analytical tools play a pivotal role in validating projections against industry trends. By cross-referencing your startup’s financial forecasts with historical data and market performance, these tools help refine your valuation estimates. This process reduces the risk of overestimating or underestimating your startup’s worth, ensuring that your valuation aligns with investor expectations and market realities.

Bridging Gaps and Reducing Risks

Combining multiple valuation methods and leveraging extensive data sources creates a more balanced and reliable valuation framework. This approach bridges gaps between theoretical projections and practical market realities, reducing estimation risks and enhancing credibility. By synthesizing diverse techniques, founders can present a valuation that resonates with investors, aligns with industry standards, and reflects the true potential of their startup.

How Brex Can Help Scale Up Your Startup

Scaling a startup requires more than just ambition—it demands financial resilience and strategic planning. Brex offers innovative solutions tailored to the unique challenges of growing ventures, helping startups build a solid foundation for expansion.

One of Brex’s standout features is its suite of financial tools, including business credit cards and startup accounts. These tools are designed specifically for scaling businesses, providing access to capital and streamlined expense management. By simplifying financial operations, startups can focus on growth without being bogged down by administrative hurdles.

Stress-testing financial models is another critical step in preparing for growth. This process ensures that your startup can withstand unexpected challenges and thrive in worst-case scenarios. A discussion on how to stress test financial models presents methodologies that help you assess the resilience of your financial forecasts under varied conditions. Incorporating these practices allows startups to anticipate risks and make informed decisions, ensuring long-term stability.

Brex’s tools complement these efforts by offering insights into spending patterns and cash flow, enabling startups to refine their financial strategies. Together, robust financial tools and proactive stress-testing create a framework for sustainable scaling.

As your startup grows, having the right resources and strategies in place can make all the difference. Brex empowers founders to focus on innovation while maintaining financial health, setting the stage for successful expansion.

Find More Resources to Support Your Startup Growth

Expanding your knowledge on startup valuation and financial modeling is essential for sustainable growth. To help you dive deeper, we’ve curated expert guides and tools that complement the strategies discussed earlier.

  • Explore additional valuation resources that provide detailed insights into methods like discounted cash flow analysis and comparable company analysis.
  • Access curated links to expert articles that focus on refining your approach to financial modeling, ensuring your projections align with investor expectations.

For further guidance, check out how to create a financial model for investors. This resource explains the foundational practices behind constructing robust financial projections, enhancing your startup valuation strategy.

Conclusion

Assessing a startup’s value requires a thoughtful approach that combines multiple strategies. From understanding market trends to applying diverse valuation techniques, each step plays a critical role in forming a comprehensive picture. The importance of clear, data-driven financial modeling cannot be overstated, as it serves as the backbone for accurate projections and informed decision-making.

At Qubit Capital, we understand the complexities of startup valuation and the challenges of securing the right funding. If you’re looking to secure the right funding, we can help with our Fundraising Assistance service. Let us guide you through the process and help you achieve your financial goals.

Key Takeaways

  • Using multiple valuation methods improves the accuracy of startup valuations
  • Each method, from Berkus to DCF, provides distinct insights suited to different growth stages
  • Real-world cases like Uber and Airbnb show how these methods work in practice
  • Strong financial tools and reliable databases enhance valuation credibility
  • Combining qualitative and quantitative techniques is key to informed funding decisions
Categories
Financial Modeling

Customer Acquisition Model in Financial Forecasts: Project Growth Accurately

Accurate growth projections begin with a solid understanding of your customer acquisition model. This framework not only helps businesses estimate the cost of acquiring new customers but also plays a pivotal role in aligning marketing strategies with financial forecasts. By integrating customer acquisition costs (CAC) into broader financial models, companies can uncover insights that drive sustainable growth.

The analysis on how to create a financial model for investors lays the groundwork that supports the strategic elements of your customer acquisition efforts within broader financial forecasting. This connection ensures that businesses can anticipate revenue streams while optimizing their CAC forecasts.

In this blog, we’ll explore how combining customer acquisition models with financial forecasts can refine growth predictions and attract investor confidence. Let’s jump right in!

How Customer Acquisition Models Work for Your Business

A customer acquisition model is the blueprint for attracting and converting new clients effectively. It combines a variety of tools, strategies, and platforms to create a system that drives sustainable growth. By focusing on key financial metrics like Customer Acquisition Cost (CAC) and Lifetime Value (LTV), businesses can ensure their efforts are both efficient and profitable.

At its core, this model integrates multiple marketing channels—such as social media, email campaigns, and paid advertisements—to guide potential customers through the sales funnel. Each channel plays a role in building awareness, nurturing interest, and ultimately driving conversions. The success of this process hinges on tracking and optimizing conversion metrics, which provide insights into what works and what doesn’t.

The financial sustainability of a customer acquisition model depends on maintaining a healthy CAC-to-LTV ratio. CAC measures the cost of acquiring a single customer, while LTV estimates the revenue a customer will generate over their relationship with your business. A well-structured model ensures that the revenue from each customer far outweighs the cost of acquiring them. Insights on the best financial forecasting software for startups illustrate tool options that can refine the precision of your customer acquisition models.

What Drives Successful Customer Acquisition?

Customer acquisition is a dynamic process influenced by a blend of marketing strategies and financial metrics. To build a robust acquisition model, businesses must evaluate key components such as acquisition channels, conversion rates, budgeting dynamics, spend volume, consumer confidence, and historical Customer Acquisition Cost (CAC) data. Each of these elements plays a pivotal role in shaping financial forecasts and driving sustainable growth.

1. Acquisition Channels and Conversion Rates

The foundation of any customer acquisition strategy lies in identifying the most effective channels. Whether through paid advertising, organic search, or social media, businesses must tailor their approach to align with their target audience. Conversion rates act as the critical measure of success, revealing how efficiently these channels turn prospects into customers. For example, integrating tools like the Customer Acquisition Cost (CAC) Calculator can provide precise metrics to evaluate channel performance and optimize strategies.

2. Budgeting Dynamics and Spend Volume

Effective budgeting is essential for maximizing returns on marketing spend. Historical data, such as the “$10.5k per $1” correlation between ad spend and CAC, highlights the importance of balancing spend volume with expected outcomes. Businesses can use this ratio to adjust forecast models and allocate resources strategically. Additionally, tools like the CAC & LTV Dashboard offer a combined view of CAC and customer lifetime value, enabling more informed financial planning.

3. Consumer Confidence and Historical CAC Data

External factors, such as consumer confidence, significantly impact acquisition costs. Lower confidence often correlates with higher CAC, making it crucial to incorporate this trend into forecasting algorithms. Historical CAC data provides a benchmark for evaluating performance over time, helping businesses identify patterns and refine their strategies.

Plan Your CAC Forecasts for Short-Term and Long-Term Success

Predicting customer acquisition costs (CAC) effectively requires a balance between historical insights and real-time data. By combining paid and organic channels, refining your sales funnel, and adjusting for market trends, you can create accurate forecasts that drive both immediate and sustained growth.

1. Use Historical Data to Establish Baselines

Start by analyzing past performance metrics to identify patterns in your CAC. For example, the aggregate CAC model for November 2022 showed a 6.3% error, with predictions at $31.34 compared to the actual $33.46. This demonstrates the importance of benchmarking forecast accuracy against historical data to refine your models. You can embed external resources like this Twitter post to validate your model’s precision.

Additionally, month-to-month variances, such as March’s $86.29 forecast versus the actual $65.21, highlight the need to recalibrate models regularly. These discrepancies can be used to adjust your projections and account for seasonal or campaign-specific fluctuations.

2. Incorporate Real-Time Metrics for Short-Term CAC Predictions

Short-term CAC forecasting benefits from live performance data, such as search volume trends. A -0.72 correlation between higher search volume and slower CAC growth suggests that increased organic interest can reduce acquisition costs. Factor this inverse relationship into your financial models to optimize spending during high-demand periods.

Real-time metrics also allow you to respond quickly to market shifts. For example, if paid ad performance dips unexpectedly, reallocating resources to organic channels can stabilize your CAC. This agility ensures your short-term forecasts remain actionable and aligned with current conditions.

3. Develop Long-Term CAC Models with Trend Analysis

Long-term success depends on identifying growth trajectories and industry benchmarks. For instance, customer acquisition often follows an accelerating upward trajectory, which can be integrated into your forecasting models using growth multipliers. This approach ensures your predictions remain realistic while accounting for scaling efforts over time.

To refine long-term forecasts, adjust for spend variances and external factors like economic shifts or competitor activity. Month-to-month data, such as April’s $105.77 forecast versus the actual $64.14, can inform adjustments to your models, ensuring they remain adaptable to changing conditions.

4. Blend Paid and Organic Channels Strategically

A balanced approach to paid and organic acquisition channels is key to optimizing CAC. Paid campaigns can deliver immediate results, while organic strategies like SEO and content marketing build sustainable growth. By analyzing the performance of each channel, you can allocate resources effectively and reduce overall acquisition costs.

For example, during periods of high search volume, prioritizing organic efforts can capitalize on the inverse correlation between search trends and CAC growth. Conversely, paid campaigns can be ramped up during slower periods to maintain consistent acquisition rates.

5. Refine Forecasts with Scenario Analysis

Scenario planning is essential for preparing CAC forecasts that account for variable conditions. Learn more about how to perform scenario analysis in financial modeling to evaluate potential outcomes and refine your predictions. This approach ensures your forecasts remain robust, even when external factors shift unexpectedly.

Improve Your CAC Model with Proven Strategies

Refining your customer acquisition cost (CAC) model requires a blend of precision and adaptability. By implementing proven strategies, businesses can enhance forecasting accuracy and reduce errors, making their models more appealing to investors and operationally efficient.

1. Transition to Daily CAC Modeling

Switching from monthly to daily CAC modeling can significantly improve the granularity of your forecasts. Daily modeling captures short-term fluctuations in customer behavior and external market trends, offering a clearer picture of acquisition costs. This approach minimizes forecast errors and ensures your projections remain relevant in dynamic markets.

2. Integrate Marketing Calendars

Aligning your CAC model with your marketing calendar is another effective strategy. By incorporating campaign schedules, seasonal promotions, and planned ad spend, you can better anticipate spikes or dips in acquisition costs. This synchronization ensures your forecasts reflect real-world marketing activities, improving their reliability.

Advanced techniques like Fourier transforms can uncover patterns in Google impression trends, helping you predict customer acquisition costs more accurately. These mathematical tools analyze cyclical data, revealing insights into how search engine activity impacts your marketing performance. Integrating these trends into your CAC model can refine your forecasts and optimize your marketing strategies.

4. Adopt an aMER-Based Approach

An aMER (adjusted Marketing Efficiency Ratio)-based approach focuses on balancing acquisition costs with marketing efficiency. By evaluating the effectiveness of your campaigns relative to their costs, you can identify areas for improvement and allocate resources more strategically. This method ensures your CAC model remains both cost-effective and performance-driven.

For businesses looking to scale their forecasting capabilities, automation plays a crucial role. An overview of ai financial modeling tools explains how technology-driven automation supports more consistent analysis in your customer acquisition modeling.

Enhancing CAC models is not just about improving accuracy—it’s about creating a framework that adapts to market changes and supports long-term growth.

What Your CAC Forecast Results Can Teach You

Forecasting Customer Acquisition Cost (CAC) is a critical exercise, but discrepancies between predicted and actual results often reveal valuable insights. These variances can stem from multiple factors, including underspending, unexpected marketing performance, or challenges with onboarding new clients.

One common issue is underspending on campaigns. If your forecast assumes a higher budget than what is actually allocated, the results will naturally deviate. Similarly, superior marketing execution can outperform the assumptions baked into your model, leading to lower-than-expected CAC values. Backtesting data, for instance, revealed a Mean Absolute Error (MAE) of $2.45 in CAC forecasts. This highlights the importance of using MAE to adjust forecasting model accuracy and refine future predictions.

Historical trends also play a significant role. Stable CAC data from prior periods often serves as a reliable predictor for upcoming performance. However, extending forecasts too far into the future introduces risks, as market conditions and customer behaviors can shift unexpectedly. To mitigate this, granular modeling adjustments—such as segmenting forecasts by customer type or campaign—can improve accuracy.

Another consideration is the onboarding of new clients. New customer acquisition often comes with unforeseen costs, which can skew results if not accounted for in the model. To ensure resilience in your projections, it’s worth examining how to stress test financial models. This approach provides a framework for validating CAC assumptions under varying conditions.

Conclusion

Accurate customer acquisition forecasts demand a strategic blend of advanced analytics, daily modeling, and investor-focused enhancements. By integrating marketing variables with financial data, businesses can achieve precise growth projections that resonate with stakeholders. This approach not only optimizes forecasting but also ensures alignment with broader financial goals.

If you’re ready to refine your financial forecasts, connect with our Financial Model Creation service to ensure your projections drive investor confidence.

Key Takeaways

  • Accurate customer acquisition models depend on combining marketing and financial data
  • Daily-level modeling and real-time analytics help minimize forecast errors
  • Techniques like Fourier transforms adjust for seasonality in trends
  • Investor-focused enhancements improve model clarity and trustworthiness
  • Consistent refinement using actionable data and strong tools boosts CAC forecasting
Categories
Financial Modeling

Cost of Equity Formula: How to Calculate and Apply It

Cost of equity is essential for businesses aiming to evaluate shareholder expectations and make informed financial decisions. This metric represents the return investors demand for their equity investment, serving as a cornerstone of corporate finance. Whether you’re assessing funding options or analyzing investment risks, mastering the cost of equity formula can provide clarity and direction.

Before diving into the formula itself, it’s helpful to establish a solid foundation in financial modeling. Your exploration of financial modeling fundamentals naturally connects with the guidance offered in how to create a financial model for investors, which outlines the framework behind constructing comprehensive projections.

This blog will explore key methods for calculating the cost of equity, its practical applications, and its impact on strategic decision-making.

What Is the Cost of Equity and How Do You Calculate It?

Cost of equity represents the return investors expect for taking on the risk of owning a company’s stock. It is a critical metric in corporate finance, influencing decisions on funding strategies and valuation models. By understanding this concept, businesses can better assess whether to raise capital through equity or debt.

Methods to Calculate the Cost of Equity

There are several approaches to determine the cost of equity, with the Capital Asset Pricing Model (CAPM) and the Dividend Capitalization Model being the most widely used.

  • Capital Asset Pricing Model (CAPM):
    CAPM calculates the cost of equity using the formula:
    Cost of Equity = Risk-Free Rate + Beta × (Market Return – Risk-Free Rate)
    This method factors in the risk-free rate (e.g., government bond yields), the stock’s beta (a measure of volatility compared to the market), and the expected market return. CAPM is particularly useful for companies without consistent dividend payments.

  • Dividend Capitalization Model:
    For dividend-paying companies, this model estimates the cost of equity as:
    Cost of Equity = (Dividends per Share / Current Stock Price) + Growth Rate of Dividends
    This approach assumes that future dividends will grow at a steady rate, making it ideal for mature companies with predictable dividend policies.

What to Keep in Mind When Calculating Cost of Equity

Determining the cost of equity can be challenging, especially when traditional dividend-based models fall short. Companies that do not pay regular dividends, such as growth-focused firms or startups, often find these models restrictive. This limitation arises because dividend discount models rely heavily on consistent dividend payouts to estimate equity costs accurately. Without this data, alternative methods become essential.

Market volatility further complicates the calculation. Fluctuations in stock prices and broader economic uncertainty can distort traditional metrics like beta, which measures a stock’s sensitivity to market movements. For firms operating in volatile industries, using rolling beta estimates can improve accuracy. For example, Global Tech Inc. reduced its weighted average cost of capital (WACC) estimation error by 18% through this approach.

Firm-specific risks, such as operational challenges or ESG considerations, also demand attention. With 67% of S&P 500 companies now disclosing ESG-adjusted cost of equity, it’s clear that non-financial factors increasingly influence financing costs. These risks highlight the importance of tailoring the cost of equity formula to reflect unique business conditions.

By incorporating dynamic methods and accounting for firm-specific variables, businesses can achieve more precise equity cost estimations, ensuring better financial decision-making.

A Complete Breakdown of the CAPM Formula

The Capital Asset Pricing Model (CAPM) formula is a cornerstone in finance, offering a reliable method to calculate the cost of equity. At its core, the formula is expressed as: Cost of Equity = Risk-Free Rate + Beta * (Market Return – Risk-Free Rate). Each component plays a pivotal role in determining the expected return for an investment.

The risk-free rate, often derived from Treasury yields, represents the baseline return investors expect without taking on any risk. For example, the 10-year Treasury yield recently reached 4.2% in Q1 2025, showcasing its importance in CAPM calculations. The beta value, a measure of an asset’s volatility relative to the market, is equally critical. A higher beta, such as the technology sector’s average of 1.25 in 2024, indicates greater sensitivity to market movements. Finally, the market return reflects the average performance of the equity market, often benchmarked against indices like the S&P 500.

Regular updates to these inputs are essential, especially in volatile markets. Beta values can shift due to sector trends, and the risk-free rate fluctuates with economic conditions. Emerging technologies, such as machine learning in beta estimation, are reducing forecasting errors, with adoption rates climbing to 23%.

For accurate financial projections, integrating tools like the best financial forecasting software for startups ensures precise data sourcing for CAPM coefficients. Explore this resource to enhance your calculations.

How Does Cost of Equity Compare to Total Capital Costs?

The cost of equity formula often reveals a higher expense compared to debt financing, primarily due to the risk premium demanded by equity investors. This disparity significantly impacts the Weighted Average Cost of Capital (WACC), which combines both debt and equity costs to determine a company’s overall capital expense structure. While debt financing typically offers lower interest rates and tax advantages, equity financing compensates investors for the inherent risks of ownership, driving up the cost.

Balancing these two components is essential for financial strategy. Companies often rely on cheaper debt to reduce WACC, but excessive debt can increase financial risk, potentially outweighing its cost benefits. Equity, though more expensive, provides stability and avoids the repayment obligations tied to debt.

Where You Can Use the Cost of Equity Formula in Practice

The cost of equity formula plays a pivotal role in both investment decisions and corporate financial strategies. For investors, it serves as a tool to evaluate risk-adjusted returns, helping them determine whether a particular investment aligns with their expected rate of return. By incorporating this formula into valuation methods, investors can assess whether the potential rewards justify the inherent risks of an asset or portfolio.

On the corporate side, the cost of equity is integral to budgeting and capital allocation. Companies use it to calculate their weighted average cost of capital (WACC), which informs decisions on funding new projects or expanding operations.

This ensures that resources are allocated to initiatives that generate returns exceeding the cost of equity, thereby maximizing shareholder value. Additionally, businesses can apply the formula to evaluate how external factors, such as market volatility, impact their financial strategies.

Clear Examples to Help You Calculate Cost of Equity

Using the Capital Asset Pricing Model (CAPM), let’s explore how variations in inputs like beta or market returns can impact the final cost of equity figure.

Consider Company A, which has a beta of 1.1, a risk-free rate of 1%, and a market return of 10%. Plugging these values into the CAPM formula:

Cost of Equity = Risk-Free Rate + Beta × (Market Return – Risk-Free Rate)

The calculation yields:
Cost of Equity = 1% + 1.1 × (10% – 1%) = 10.9%

Now, imagine the beta increases slightly to 1.2. The revised cost of equity would be:
Cost of Equity = 1% + 1.2 × (10% – 1%) = 11.8%

Combine Sources Effectively with Weighted Average Cost of Equity

When multiple equity sources are involved, calculating a unified cost of equity becomes essential for accurate financial analysis. A weighted average cost of equity integrates the costs from various share classes, such as common and preferred equity, into a single, comprehensive metric. This approach ensures that the blended financing structure is accurately reflected in your calculations.

To compute this, assign weights to each equity source based on its proportion in the total equity pool. Then, multiply these weights by their respective costs of equity and sum the results. This method not only simplifies complex equity structures but also provides a clearer picture of the overall cost of financing.

Automation can streamline calculations of weighted average cost of equity across multiple funding rounds. Emerging technology’s impact on projections is reflected in ai financial modeling tools, which demonstrates the integration of automation into your routine financial assessments.

How to Calculate Cost of Equity Using the Dividend Model

The dividend capitalization model offers a straightforward method to compute the cost of equity for companies with consistent dividend payouts. This approach relies on two key components: the current dividend yield and the anticipated growth rate of dividends.

For example, consider a company that pays an annual dividend of $2 per share, with its stock currently trading at $50. If the company’s dividends are expected to grow at a steady rate of 5% annually, the cost of equity formula is applied as follows:

Cost of Equity = (Dividend / Current Stock Price) + Dividend Growth Rate
Cost of Equity = ($2 / $50) + 5% = 9%

This calculation indicates that the company’s cost of equity is 9%. The dividend model is particularly effective for firms with a stable dividend history, as it provides a reliable estimate of the return shareholders expect.

How to Track Cost of Equity in Excel Using CAPM

Calculating the cost of equity formula in Excel using the Capital Asset Pricing Model (CAPM) is a straightforward process that can be tailored for real-time analysis. This guide walks you through the steps to set up the formula and adjust key variables for scenario testing.

Step 1: Input the CAPM Formula

Begin by entering the CAPM formula into Excel:
Cost of Equity = Risk-Free Rate + Beta × (Market Return – Risk-Free Rate)
Create separate cells for each variable—Risk-Free Rate, Beta, and Market Return—to ensure flexibility in updating values.

Step 2: Populate Variables

  • Risk-Free Rate: Input the current yield of a government bond (e.g., U.S. Treasury bond).
  • Beta: Use the beta value of the stock or portfolio, which measures its volatility relative to the market.
  • Market Return: Enter the average return of the market index, such as the S&P 500.

Step 3: Automate Calculations

Use Excel formulas to link the variables to the CAPM equation. For example, if Risk-Free Rate is in cell A1, Beta in A2, and Market Return in A3, the formula in A4 would be:
=A1 + A2*(A3-A1)

Step 4: Perform Scenario Testing

To learn how changes in variables impact the cost of equity, adjust the values in the input cells. For example, increase Beta to simulate higher volatility or lower the Risk-Free Rate to reflect market conditions.

Scenario testing can also be enhanced by learning how to stress test financial models, which ensures your calculations remain robust under varying conditions.

Use This Free Tool to Calculate Cost of Equity

Calculating the cost of equity can be streamlined with the right resources. The CFI Cost of Equity Calculator is a downloadable Excel template designed to simplify this process using the CAPM approach. This tool allows users to compute the cost of equity formula quickly while enabling scenario analysis by adjusting CAPM inputs on-the-fly.

With its intuitive design, the calculator is perfect for hands-on practice, offering efficiency and precision for financial professionals and students alike. Download the Equity Calc today to explore its features and enhance your understanding of equity valuation.

How Equity Costs Compare to Debt Financing Costs

Equity financing often demands higher returns because investors take on greater risk. Unlike debt financing, which typically incurs a fixed interest rate—such as a typical cost of debt percentage of 4%—equity investors expect a premium for the uncertainty tied to their investment. This premium reflects the higher cost of equity compared to debt.

Debt financing, while generally more affordable, introduces its own challenges. Increased borrowing can amplify a company’s financial obligations, potentially raising its risk profile. As Capital Struct highlights, interest rate fluctuations can significantly influence decisions between debt and equity financing.

Adding Cost of Equity into Your WACC Calculations

The cost of equity plays a pivotal role in determining the weighted average cost of capital (WACC), as equity investors typically demand higher returns compared to debt holders. WACC combines the costs of debt and equity, creating a blended rate that reflects the overall cost of financing a business. Since equity investors expect greater returns due to the inherent risks of ownership, the cost of equity often has a significant impact on the final WACC calculation.

Accurate estimation of the cost of equity is essential for precise WACC calculations. Misjudging this figure can distort financial models and lead to flawed investment decisions. Tools like the WACC Formula demonstrate how equity costs factor into an overall enterprise discount rate. For those looking to refine their calculations further you can look through advanced financial modeling techniques to balance equity and debt effectively.

Include Cost of Equity in Your Financial Models

As the discount rate in discounted cash flow (DCF) analyses, it directly impacts the valuation of projected cash flows. By incorporating the cost of equity formula, businesses can better estimate the returns required by shareholders, ensuring their models reflect realistic expectations.

Scenario testing that integrates equity risk parameters further refines these calculations. Adjusting for variables such as market volatility or changes in risk-free rates enhances the precision of financial forecasts, making them more adaptable to real-world conditions. This approach not only strengthens valuation accuracy but also supports strategic decision-making in uncertain environments.

Conclusion

Precise cost of equity calculations are more than just numbers—they are essential tools for strategic financial planning. Throughout this blog, we explored key strategies and insights that emphasize the importance of accuracy in these calculations. From understanding the foundational components to applying them in real-world scenarios, the value of informed decision-making cannot be overstated.

As businesses aim to optimize their financial strategies, the ability to calculate and interpret the cost of equity becomes a cornerstone for sustainable growth. This process not only aids in evaluating investment opportunities but also strengthens the overall financial framework of an organization.

If you’re ready to integrate these insights into your strategic financial presentations, we invite you to explore our Pitch Deck Creation service. Let’s collaborate to craft compelling presentations that align with your financial goals.

Key Takeaways

  • The cost of equity formula helps determine the return investors expect for risk exposure
  • CAPM and Dividend Capitalization are key methods for calculating cost of equity
  • Market volatility and company-specific risks play a major role in the calculation
  • Excel examples and downloadable tools support practical application
  • Grasping these concepts is crucial for sound financial decisions and capital structuring