 Back
Back


Table of Contents
Preparing financial reports that resonate with investors begins with understanding their expectations. Investors rely on these documents to assess the financial health and future potential of a business, making clarity and transparency essential. But what is financial report writing? At its core, it involves presenting financial data in a structured, comprehensible format that builds trust and facilitates decision-making.
To further enhance your reports, consider hiring a financial modeling consultant who can provide expertise in structuring and validating financial data. By focusing on precision and readability, businesses can transform complex financial information into actionable insights, ensuring investors feel confident in their decisions. This blog will explore the key elements of creating investor-friendly financial reports, offering actionable strategies to refine your approach.
What are Financial Analysis Reports?
Financial analysis reports are indispensable tools for evaluating a company’s financial health and operational performance. They compile critical data to offer insights into profitability, liquidity, and overall stability. For stakeholders, knowing how to write a financial report is essential. These documents serve as the foundation for assessing business viability and growth potential.
- Core Components:
- Income Statements
- Balance Sheets
- Cash Flow Statements
These components provide a structured overview of a company’s financial standing and are crucial for both internal assessments and regulatory compliance.
Financial analysis reports ensure transparency in financial disclosures, meeting legal requirements and maintaining investor and regulator trust. They outline key metrics like revenue growth, debt ratios, and return on equity. For investors, these metrics help identify opportunities and risks, ensuring that investments align with financial goals.
Businesses also benefit by using these reports to pinpoint areas for improvement, optimize operations, and strategize for future growth. In essence, financial analysis reports are not just numbers on a page—they are strategic tools that guide decision-making, foster accountability, and support sustainable practices.
Benefits and Impact of Financial Analysis Reports
Financial analysis reports serve as indispensable tools for businesses, offering clarity and actionable insights into their financial health. Preparing financial reports not only ensures operational stability but also fosters trust among stakeholders by presenting data transparently. These reports provide a structured approach to tracking cash flow, forecasting future trends, and simplifying complex processes like taxation.
1. Promotes Transparency and Building Trust
A clear presentation of financial data is essential for building stakeholder trust. When businesses share well-organized reports, stakeholders—including investors, employees, and creditors—gain confidence in the company's ability to manage resources effectively. Transparency in financial reporting demonstrates accountability, ensuring that all parties involved have access to accurate information.
2. Accurate Cash Flow Tracking
Maintaining liquidity is vital for operational stability, and financial analysis reports excel at tracking cash flow. By monitoring inflows and outflows, businesses can identify patterns and address discrepancies promptly. This ensures that resources are allocated efficiently, preventing potential cash shortages that could disrupt operations.
3. Supports Predictive Forecasting
Historical data analysis plays a pivotal role in predictive forecasting. By examining past performance and integrating real-time data, businesses can anticipate future trends and make informed decisions. For instance, forecasting models can help identify seasonal sales patterns or predict revenue fluctuations, enabling companies to plan for growth effectively. As highlighted in the raw data, using forecasting models to analyze trends can uncover valuable insights that drive strategic planning.
4. Simplifies Taxation
Taxation processes often involve intricate calculations and compliance requirements. Financial analysis reports simplify this by organizing relevant data, ensuring that businesses meet their obligations without unnecessary complications. Accurate documentation minimizes errors and reduces the risk of penalties, making taxation more manageable.
5. Allows for Periodic Reviews
Periodic reviews of financial reports offer additional benefits that contribute to long-term stability and growth. These reviews help businesses manage debts effectively, ensuring that repayment schedules align with cash flow capabilities. They also enhance profitability by identifying areas where costs can be reduced or revenues optimized.
Investor-friendly reports must include financial documents required by investors to ensure accuracy and build trust during presentations. Incorporating these documents into periodic reviews strengthens the company's position during investor discussions and supports strategic decision-making.
6. Optimizes Inventory and Ensures Revenue Stability
Financial analysis reports can also guide inventory management. By analyzing sales data and inventory turnover rates, businesses can avoid overstocking or understocking, which directly impacts profitability. Additionally, these reports help ensure revenue stability by identifying consistent income streams and highlighting areas for improvement.
7. Drives Growth
Ultimately, financial analysis reports serve as a roadmap for growth. By providing comprehensive insights into profitability, liquidity, and operational efficiency, these reports empower businesses to make data-driven decisions. Whether it's expanding into new markets or investing in innovation, the information contained in these reports lays the foundation for sustainable growth.
Financial analysis reports are more than just numbers—they are strategic tools that help businesses thrive in a competitive environment.
Step-by-Step Guide to Writing Financial Analysis Reports
Crafting a financial analysis report that resonates with investors requires precision, clarity, and a structured approach. This guide provides a detailed roadmap for preparing financial reports, covering everything from company overviews to advanced valuation techniques. By following these steps, you can create investor-friendly reports that inspire confidence and drive informed decision-making.
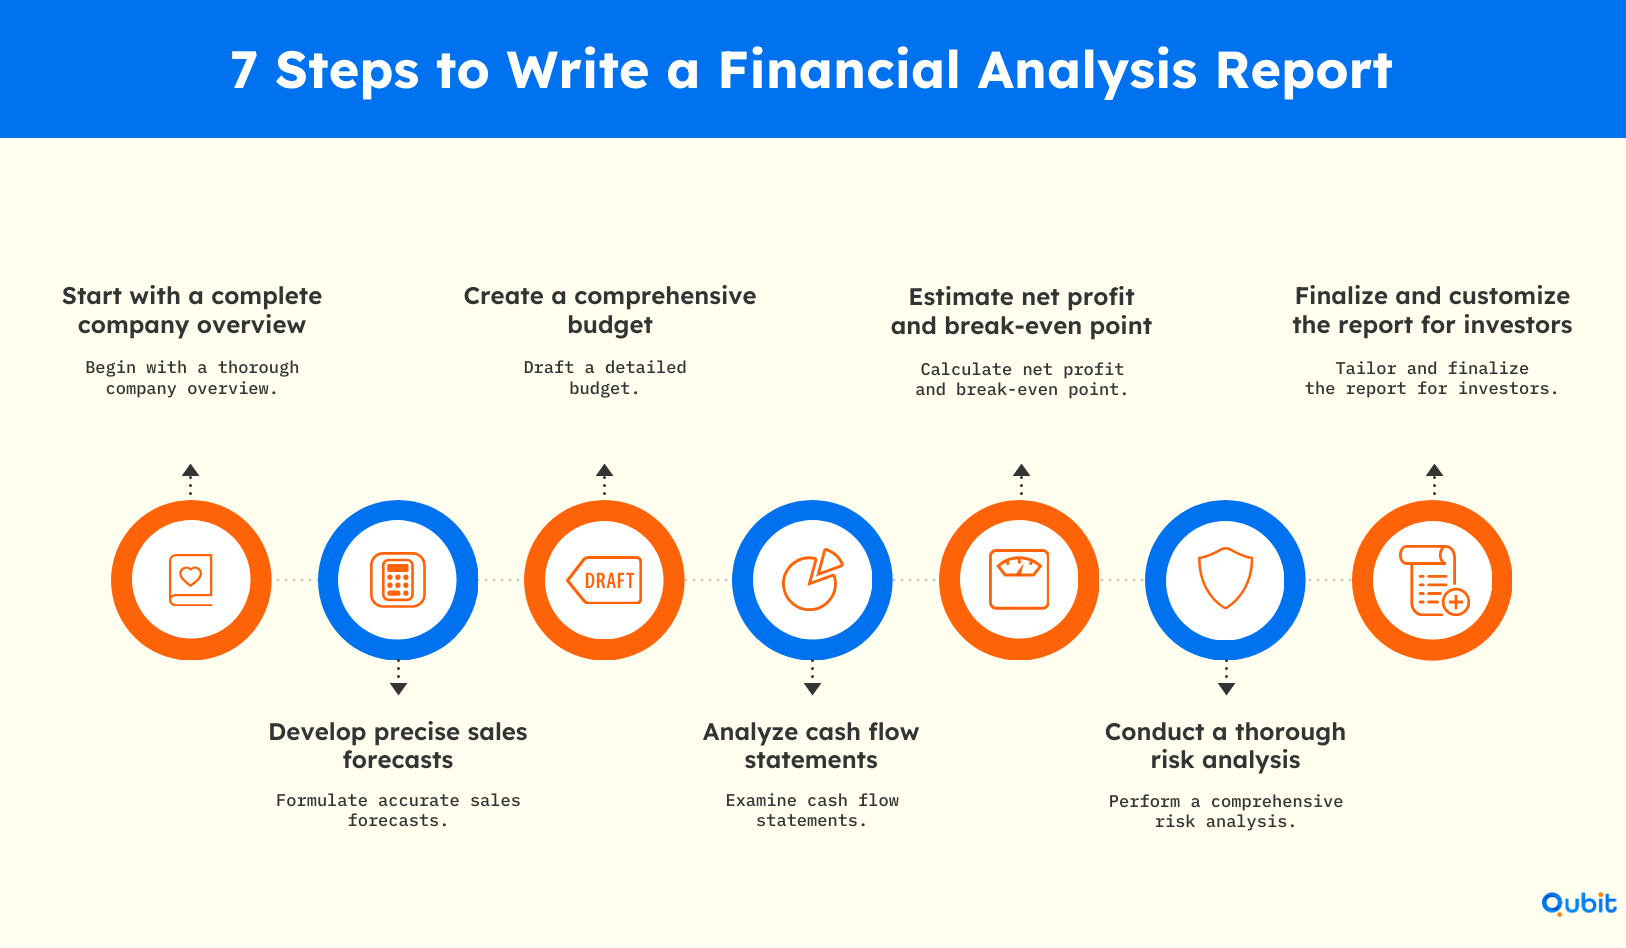
1. Start with a Comprehensive Company Overview
Begin your report by presenting a clear and concise company overview. This section should include the company’s mission, key products or services, market position, and recent achievements. Highlighting competitive advantages using tools like Porter's Five Forces can add depth to your analysis. Use this model to showcase how the company stands out in its industry, emphasizing factors such as supplier power, buyer behavior, and competitive rivalry.
2. Develop Accurate Sales Forecasts
Sales forecasting is a critical step in financial report writing. Use historical data, market trends, and industry benchmarks to project future revenue. Ensure your forecasts are realistic and supported by data, as this builds trust with investors. Incorporate visual representations like charts and graphs to make your projections more digestible.
3. Create a Detailed Budget
A well-structured budget provides a roadmap for managing expenses and optimizing profitability. Break down costs into fixed and variable categories, and allocate resources effectively. This step ensures that your financial report reflects the company’s ability to control spending while maintaining operational efficiency.
4. Analyze Cash Flow Statements
Cash flow analysis is essential for evaluating the company’s liquidity and operational health. Use techniques like Discounted Cash Flow (DCF) analysis to project future cash flows and determine the company’s valuation. Apply DCF analysis to illustrate how the business generates value over time, providing investors with a clear picture of financial stability.
5. Estimate Net Profit and Break-Even Point
Calculating net profit and the break-even point reassures investors of the company’s profitability and stability. For instance, the break-even point can be determined using the formula:
Break-Even Point = Fixed Costs / (Sales Price per Unit - Variable Cost per Unit)
Include this calculation in your report to demonstrate the company’s ability to cover costs and achieve profitability under various scenarios.
6. Conduct Risk Analysis
Risk analysis is a vital component of financial reporting. Use frameworks like the PESTLE template to evaluate external factors that may impact the business, such as political, economic, social, technological, legal, and environmental risks. Additionally, learn how to document assumptions in financial models clearly to address potential investor concerns effectively. Transparent documentation of assumptions ensures that your report is both credible and actionable.
7. Finalize and Tailor the Report for Investors
Once all sections are complete, focus on refining the report to make it visually appealing and easy to understand. Use professional formatting, include relevant charts and graphs, and tailor the language to align with investor priorities. A polished report not only communicates financial insights but also enhances investor confidence.
By integrating advanced techniques like DCF analysis and break-even calculations, and presenting data in a structured, visually engaging format, your financial analysis report can stand out as a reliable tool for decision-making.
Common Pitfalls in Financial Report Writing and How to Avoid Them
Crafting a financial report requires precision, clarity, and a focus on delivering actionable insights. However, several common mistakes can undermine the effectiveness of these reports. By understanding these pitfalls, you can ensure your financial reporting stands out for its accuracy and impact.
1. Avoid Overloading with Unnecessary Details
Including excessive data can overwhelm readers and dilute the core message of your report. While it's important to provide comprehensive information, focus on the most relevant metrics and insights that align with your audience's needs. To streamline your report, prioritize clarity and conciseness over exhaustive detail.
2. Ensure Rigorous Data Validation
Errors in data can quickly erode trust and credibility. Double-check all figures, calculations, and sources to ensure accuracy. Implementing robust validation processes will not only enhance the reliability of your report but also demonstrate your commitment to professionalism. For further guidance on maintaining compliance and accuracy, explore how to prepare for financial due diligence to ensure your reports meet investor expectations.
3. Provide Actionable Recommendations
A financial report should go beyond presenting numbers—it should offer clear, actionable insights. Investors and stakeholders value recommendations that help them make informed decisions. Highlight trends, identify risks, and suggest strategies to address challenges or capitalize on opportunities.
4. Incorporate Visual Aids
Graphs, charts, and tables can significantly improve comprehension and engagement. Visual aids simplify complex data, making it easier for readers to grasp key takeaways. Use visuals strategically to emphasize important points and enhance the overall readability of your report.
5. Include an Executive Summary
The absence of an executive summary can make your report less accessible, especially for time-constrained readers. Summarize the key findings, conclusions, and recommendations in a concise format at the beginning of the report. This ensures stakeholders can quickly understand the essence of your analysis without diving into the full details.
Using Financial Tools & Technology for Enhanced Reporting
Efficient financial reporting is no longer a tedious process, thanks to innovative tools and technologies. By integrating automation and real-time data tracking, businesses can streamline operations and ensure accuracy in their financial statements.
Streamlining Expense Management with Advanced Tools
Tools like Fyle and Expensify simplify expense management by automating receipt scanning and categorization. For instance, using a Receipt Scanning App, businesses can scan receipts in real-time, automatically categorize expenses, and minimize errors during transaction entry. Expensify’s Preaccounting Software further enhances this process by continuously categorizing financial data, ensuring seamless reporting.
A 5-Step Process for Automated Financial Statements
Adopting a systematic approach to financial reporting ensures compliance and accuracy. Here’s a 5-step process that integrates automation and technology:
- Data Collection: Start by gathering financial data using integrated tools like Expensify. These tools automatically upload and categorize expenses, saving time and reducing manual errors.
- Real-Time Tracking: Use platforms with real-time integrations to monitor transactions and identify discrepancies. Expensify’s Integrations with accounting software highlight inconsistencies during data reconciliation.
- Automation: Automate repetitive tasks, such as receipt scanning and categorization, to improve operational efficiency.
- Validation: Collaborate with external Accountants to audit or review financial statements for compliance using shared reporting features.
- Report Drafting: Draft financial statements using tools that integrate seamlessly with accounting platforms, ensuring accuracy and compliance.
Integration with Investor-Ready Reporting
Creating investor-friendly financial reports is a crucial step within the broader process of financial model creation for investors. These tools ensure projections are robust and transparent, making them ideal for attracting investors.
Real-World Reporting Examples and Advanced Data Visualization
Pre-built dashboards and templates are transforming how businesses approach financial performance monitoring. Tools like the QuickBooks Dashboard offer plug-and-play solutions for real-time tracking of key metrics. For instance, this Databox template simplifies the visualization of profit and loss trends over time, making it easier to identify patterns and opportunities.
Customizable templates, such as the Xero Dashboard, take financial reporting to the next level. By organizing and visualizing sales and expense data, this tool provides real-time insights into profitability metrics. Businesses can integrate this template to streamline reconciliation processes and improve expense management, saving time and reducing errors.
Platforms like Databox also provide a wide range of pre-built templates tailored to various financial needs. These dashboards make complex data visualization accessible, enabling businesses to track metrics like profit, expenses, and revenue with ease.
Real-world examples demonstrate how businesses have achieved significant improvements in financial oversight, from faster reconciliations to more effective expense tracking.
Conclusion
Clear communication and detailed financial analysis are essential for building investor confidence. Throughout this blog, we’ve explored actionable strategies that emphasize transparency and precision in financial reporting. From advanced forecasting techniques to integrating technology into report preparation, these steps ensure your financial story is both compelling and credible.
Clarity and actionable insights remain at the heart of successful investor presentations. By focusing on these elements, businesses can foster trust and demonstrate their readiness for growth.
Looking to revamp your investor communications? At Qubit Capital, we turn complex data into a streamlined financial model that tells your unique story. Discover our Financial Model Creation service and transform your numbers into a compelling narrative that makes an impact.
Key Takeaways
- A step-by-step approach enhances the clarity and investor-readiness of financial reports.
- Accurate, transparent reports build stakeholder trust and support strategic decision-making.
- Leveraging advanced tools like Fyle, Expensify, and Databox streamlines report creation.
- Identifying and avoiding common pitfalls is crucial for effective financial reporting.
- Real-world examples and actionable insights make complex reporting processes manageable.
Frequently asked Questions
How to generate financial reports?
Financial reports can be created by following a systematic process that begins with collecting accurate data. Once the information is gathered, validate it to ensure consistency and reliability. Next, incorporate budgeting and forecasting to provide insights into future financial performance. Finally, visualize the data using tools designed for financial reporting to make it accessible and actionable. Integrated software solutions can simplify these steps significantly.