


Table of Contents
Globally, over 150 million startups operate, including 1.14 million in the U.S. This vast field underscores why mastering cost of equity matters, as optimal funding choices impact millions of founders and investors. Understanding these metrics helps organizations compete amid the crowded capital landscape.
Cost of equity is essential for businesses aiming to evaluate shareholder expectations and make informed financial decisions. This metric represents the return investors demand for their equity investment, serving as a cornerstone of corporate finance. Whether you're assessing funding options or analyzing investment risks, mastering the cost of equity formula can provide clarity and direction.
This blog will explore key methods for calculating the cost of equity, its practical applications, and its impact on strategic decision-making.
What Is the Cost of Equity Formula and How Do You Calculate It?
Cost of equity is the expected return for stockholders. Investors require this to compensate them for risk.
Methods to Calculate the Cost of Equity
There are several approaches to determine the cost of equity, with the Capital Asset Pricing Model (CAPM) and the Dividend Capitalization Model being the most widely used.

Capital Asset Pricing Model (CAPM):
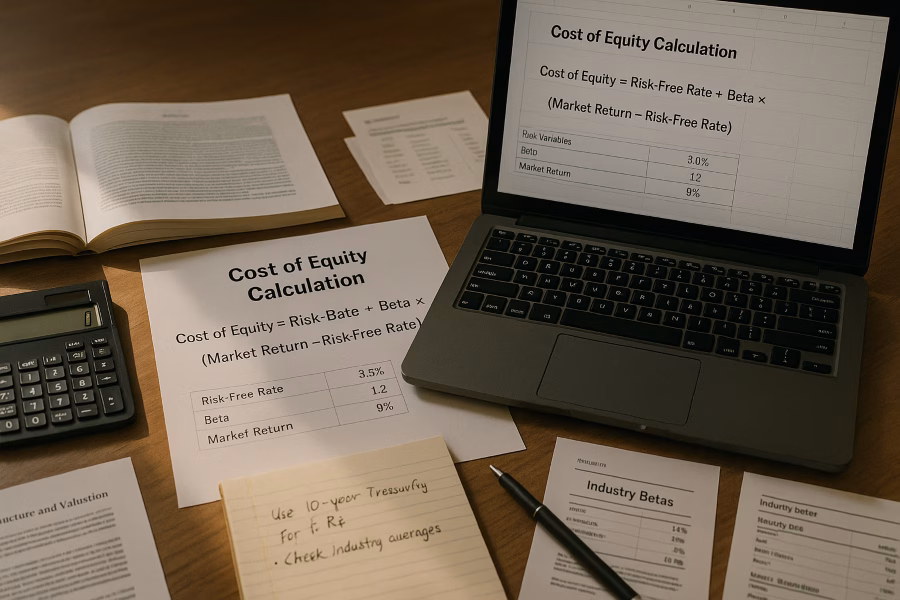
CAPM calculates the cost of equity using the formula:
Cost of Equity = Risk-Free Rate + Beta × (Market Return – Risk-Free Rate)
This method factors in the risk-free rate (e.g., government bond yields), the stock’s beta (a measure of volatility compared to the market), and the expected market return. CAPM is particularly useful for companies without consistent dividend payments.Dividend Capitalization Model:
For dividend-paying companies, this model estimates the cost of equity as:
Cost of Equity = (Dividends per Share / Current Stock Price) + Growth Rate of Dividends
This approach assumes that future dividends will grow at a steady rate, making it ideal for mature companies with predictable dividend policies.
The Build-Up Method for Private Companies
This approach is especially useful for private companies that lack reliable market data for CAPM or dividend models. The build-up method estimates cost of equity by adding a risk-free rate to various risk premiums, such as equity market, industry, size, and company-specific risks. By tailoring these premiums, businesses can better reflect their unique risk profile. This method ensures private firms can still make informed capital decisions without public market benchmarks.
Comparing Cost of Equity Calculation Methods
Startups like yours already closed their rounds with us.
Founders across every stage and industry. Here's what it took.
- Raised $7.6M for Swiipr Technologies
- Raised $0.5M for Ap Tack
- Raised €0.5M for Ivent Pro

What to Keep in Mind When Calculating Cost of Equity
1. Why dividend models can fall short
Dividend discount models depend on regular, predictable dividends. If a company reinvests heavily or pays no dividends, the model becomes less useful and you need other approaches.
2. Market volatility can distort inputs
When markets are shaky, historical assumptions can break faster. For example, Carta data showed 254 startup shutdowns in Q1 2024, up 58% from the prior year, which is a reminder that risk can spike quickly.
3. Beta is useful, but noisy
Beta can swing with price moves, time windows, and the return frequency you use. Rolling beta estimates and sense-checking against industry betas can make your CAPM output more stable.
4. Private and early-stage companies need proxies
If the company is not publicly traded, you cannot observe a true market beta. A common workaround is to use comparable public companies, take their industry beta, and adjust it for leverage and business risk.
5. Firm-specific risks may require adjustments
Operational risk, concentration risk, and ESG risks can change investor return expectations even if CAPM looks clean. Research shows ESG performance and disclosure can be linked to changes in cost of equity, so ignoring these factors can understate risk.
Determining the cost of equity can be challenging, especially when traditional dividend-based models fall short. Companies that do not pay regular dividends, such as growth-focused firms or startups, often find these models restrictive. This limitation arises because dividend discount models rely heavily on consistent dividend payouts to estimate equity costs accurately. Without this data, alternative methods become essential.
Before diving into the formula itself, it’s helpful to establish a solid foundation in financial modeling. Your exploration of financial modeling fundamentals naturally connects with the guidance offered in how to create a financial model for investors, which outlines the framework behind constructing comprehensive projections.
A Complete Breakdown of the CAPM Cost of Equity Formula
The Capital Asset Pricing Model (CAPM), a model that relates expected return to risk, is a cornerstone in finance. The risk-free rate comes from Treasury yields. It is the base return for risk-free investments. For example, the 10-year Treasury yield was 4.2% in Q1 2025.
The beta value, a measure of an asset's volatility relative to the market, is equally critical. A higher beta, such as the technology sector's average of 1.25 in 2024, indicates greater sensitivity to market movements. Finally, the market return reflects the average performance of the equity market, often benchmarked against indices like the S&P 500.
Regular updates to these inputs are essential, especially in volatile markets. Beta values can shift due to sector trends, and the risk-free rate fluctuates with economic conditions. Emerging technologies, such as machine learning in beta estimation, are reducing forecasting errors, with adoption rates climbing to 23%.
How Does Cost of Equity Compare to Total Capital Costs?
The cost of equity formula often reveals a higher expense compared to debt financing, primarily due to the risk premium demanded by equity investors. This disparity significantly impacts the Weighted Average Cost of Capital (WACC), which combines both debt and equity costs to determine a company’s overall capital expense structure. While debt financing typically offers lower interest rates and tax advantages, equity financing compensates investors for the inherent risks of ownership, driving up the cost.
Balancing these two components is essential for financial strategy. Companies often rely on cheaper debt to reduce WACC, but excessive debt can increase financial risk, potentially outweighing its cost benefits. Equity, though more expensive, provides stability and avoids the repayment obligations tied to debt.
A recent valuation for a building materials company illustrates these differences. Their cost of equity ranged 11.25–14.3%, while cost of debt was 3.40%, resulting in a WACC between 10% and 12%. This spread highlights the real impact of funding choices on total capital costs.
Where You Can Use the Cost of Equity Formula in Practice
The cost of equity formula is essential for evaluating risk-adjusted returns and making informed investment decisions.
On the corporate side, the cost of equity is integral to budgeting and capital allocation. Companies use it to calculate their weighted average cost of capital (WACC), which informs decisions on funding new projects or expanding operations.
This ensures that resources are allocated to initiatives that generate returns exceeding the cost of equity, thereby maximizing shareholder value. Additionally, businesses can apply the formula to evaluate how external factors, such as market volatility, impact their financial strategies.
Recent regulatory changes affect how growth-stage startups apply the cost of equity formula. With the QSBS Expansion Act, the asset threshold increased to $75 million for shares issued after July 4, 2025. This shift enables startups to structure offerings more effectively, influencing practical funding decisions.
Clear Examples to Help You Calculate Cost of Equity
Using the Capital Asset Pricing Model (CAPM), let’s explore how variations in inputs like beta or market returns can impact the final cost of equity figure.
Consider Company A, which has a beta of 1.1, a risk-free rate of 1%, and a market return of 10%. Plugging these values into the CAPM formula:
Cost of Equity = Risk-Free Rate + Beta × (Market Return – Risk-Free Rate)
The calculation yields:
Cost of Equity = 1% + 1.1 × (10% – 1%) = 10.9%
Now, imagine the beta increases slightly to 1.2. The revised cost of equity would be:
Cost of Equity = 1% + 1.2 × (10% – 1%) = 11.8%
Combine Sources Effectively with Weighted Average Cost of Equity
When multiple equity sources are involved, calculating a unified cost of equity becomes essential for accurate financial analysis. A weighted average cost of equity integrates the costs from various share classes, such as common and preferred equity, into a single, comprehensive metric. This approach ensures that the blended financing structure is accurately reflected in your calculations.
To compute this, assign weights to each equity source based on its proportion in the total equity pool. Then, multiply these weights by their respective costs of equity and sum the results. This method not only simplifies complex equity structures but also provides a clearer picture of the overall cost of financing.
Automation can streamline calculations of weighted average cost of equity across multiple funding rounds. Emerging technology's impact on projections is reflected in ai financial modeling tools, which demonstrates the integration of automation into your routine financial assessments.
How to Calculate the Cost of Equity Formula Using the Dividend Model
The dividend capitalization model offers a straightforward method to compute the cost of equity for companies with consistent dividend payouts. This approach relies on two key components: the current dividend yield and the anticipated growth rate of dividends.
For example, consider a company that pays an annual dividend of $2 per share, with its stock currently trading at $50. If the company’s dividends are expected to grow at a steady rate of 5% annually, the cost of equity formula is applied as follows:
Cost of Equity = (Dividend / Current Stock Price) + Dividend Growth Rate
Cost of Equity = ($2 / $50) + 5% = 9%
This calculation indicates that the company’s cost of equity is 9%. The dividend model is particularly effective for firms with a stable dividend history, as it provides a reliable estimate of the return shareholders expect.
How to Track Cost of Equity in Excel Using CAPM
Calculating the cost of equity formula in Excel using the Capital Asset Pricing Model (CAPM) is a straightforward process that can be tailored for real-time analysis. This guide walks you through the steps to set up the formula and adjust key variables for scenario testing.
Step 1: Input the CAPM Formula
Begin by entering the CAPM formula into Excel:
Cost of Equity = Risk-Free Rate + Beta × (Market Return – Risk-Free Rate)
Create separate cells for each variable—Risk-Free Rate, Beta, and Market Return—to ensure flexibility in updating values.
Step 2: Populate Variables
- Risk-Free Rate: Input the current yield of a government bond (e.g., U.S. Treasury bond).
- Beta: Use the beta value of the stock or portfolio, which measures its volatility relative to the market.
- Market Return: Enter the average return of the market index, such as the S&P 500.
Step 3: Automate Calculations
Use Excel formulas to link the variables to the CAPM equation. For example, if Risk-Free Rate is in cell A1, Beta in A2, and Market Return in A3, the formula in A4 would be:=A1 + A2*(A3-A1)
Step 4: Perform Scenario Testing
To learn how changes in variables impact the cost of equity, adjust the values in the input cells. For example, increase Beta to simulate higher volatility or lower the Risk-Free Rate to reflect market conditions.
Scenario testing can also be enhanced by learning how to stress test financial models, which ensures your calculations remain robust under varying conditions.
Use This Free Tool to Calculate the Cost of Equity Formula
Calculating the cost of equity can be streamlined with the right resources. The CFI Cost of Equity Calculator is a downloadable Excel template designed to simplify this process using the CAPM approach. This tool allows users to compute the cost of equity formula quickly while enabling scenario analysis by adjusting CAPM inputs on-the-fly.
- Download template.
- Input risk-free rate.
- Enter beta.
- Enter market return.
- Review calculated cost of equity.
With its intuitive design, the calculator is perfect for hands-on practice, offering efficiency and precision for financial professionals and students alike.
How Equity Costs Compare to Debt Financing Costs
Equity financing often demands higher returns because investors take on greater risk. Unlike debt financing, which typically incurs a fixed interest rate, such as a typical cost of debt percentage of 4%—equity investors expect a premium for the uncertainty tied to their investment. This premium reflects the higher cost of equity compared to debt.
Debt financing, while generally more affordable, introduces its own challenges. Increased borrowing can amplify a company’s financial obligations, potentially raising its risk profile.
Adding Cost of Equity into Your WACC Calculations
Public equity markets offer useful benchmarks. During recent analyses, equities market discount rate held near 5.81%, while private company equity costs remained higher. This context sharpens accuracy when integrating cost of equity into WACC calculations.
The cost of equity plays a pivotal role in determining the weighted average cost of capital (WACC), as equity investors typically demand higher returns compared to debt holders. WACC combines the costs of debt and equity, creating a blended rate that reflects the overall cost of financing a business. Since equity investors expect greater returns due to the inherent risks of ownership, the cost of equity often has a significant impact on the final WACC calculation.
Accurate estimation of the cost of equity is essential for precise WACC calculations. Misjudging this figure can distort financial models and lead to flawed investment decisions. Tools like the WACC Formula demonstrate how equity costs factor into an overall enterprise discount rate. For those looking to refine their calculations further you can look through advanced financial modeling techniques to balance equity and debt effectively.
Include Cost of Equity in Your Financial Models
As the discount rate in discounted cash flow (DCF) analyses, it directly impacts the valuation of projected cash flows. By incorporating the cost of equity formula, businesses can better estimate the returns required by shareholders, ensuring their models reflect realistic expectations.
Scenario testing that integrates equity risk parameters further refines these calculations. Adjusting for variables such as market volatility or changes in risk-free rates enhances the precision of financial forecasts, making them more adaptable to real-world conditions. This approach not only strengthens valuation accuracy but also supports strategic decision-making in uncertain environments.
Conclusion
Accurate use of the cost of equity formula is essential for strategic financial planning and informed decision-making. As businesses aim to optimize their financial strategies, the ability to calculate and interpret the cost of equity becomes a cornerstone for sustainable growth. This process not only aids in evaluating investment opportunities but also strengthens the overall financial framework of an organization.
If you're ready to integrate these insights into your strategic financial presentations, we invite you to explore our Financial Model Creation Services. Let’s collaborate to craft presentations that align with your financial goals.
Key Takeaways
- CAPM and Dividend Capitalization are key methods for calculating cost of equity
- Market volatility and company-specific risks play a major role in the calculation
- Excel examples and downloadable tools support practical application
- Grasping these concepts is crucial for sound financial decisions and capital structuring
Need numbers investors trust?
Clean assumptions, realistic projections, and a structure that holds up in diligence.
- Forecasts, unit economics, and scenario planning
- Valuation-ready outputs investors can review fast
- Clear structure so you can update it easily
Frequently asked Questions
What is the formula for cost of equity?
Formula: Cost of Equity = Risk-Free Rate + Beta × (Market Return – Risk-Free Rate). This shows the return expected for owning a company’s stock.