


Table of Contents
A bottom-up approach to market sizing provides a granular perspective by focusing on individual customer segments and their potential revenue contributions. Unlike top-down methods, which rely on broad industry data, this approach builds credibility by grounding estimates in real-world data.
This article will demonstrate how a bottom-up methodology can help startups estimate their Total Addressable Market (TAM) with precision. From segmenting your audience to validating revenue projections, we’ll guide you through every step. Let’s jump right in!
Why Bottom-Up Market Sizing Matters for Startups
A bottom-up market sizing approach gives startups a precise view of their market potential using real customer data. Understanding market potential is critical for startups aiming to attract investors and raise capital effectively.
The bottom-up market sizing approach begins with granular customer data, such as individual purchase behaviors or specific sales figures, and scales upward to calculate Total Addressable Market (TAM), Serviceable Available Market (SAM), and Serviceable Obtainable Market (SOM). This method ensures precision by focusing on real-world data rather than broad assumptions.
The formula for bottom-up market sizing typically involves multiplying the average revenue per customer by the total number of potential customers within a defined segment. For instance, using actual customer behavior data, as detailed in this bottom-up resource, startups can create realistic projections tailored to niche markets.
This approach is particularly advantageous for startup investors because it delivers actionable insights grounded in reality. Unlike top-down methods, which rely on generalized industry statistics, bottom-up sizing provides a more investor-friendly framework by aligning calculations with specific market dynamics.
Explorations of market sizing naturally extend into the startup fundraising strategies discussion, where broader capital acquisition approaches complement your analysis.
Top-Down vs. Bottom-Up Market Sizing: What You Need to Know
Market sizing is one of the first things investors look at, and the way you calculate it can make your projections look either sharp and credible—or fluffy and wishful. Bottom-up market sizing helps you avoid the fluff by building your market opportunity from real, observable segments instead of big, vague industry numbers.
The top-down method is popular because it’s fast and simple. You start with a big industry figure, then slice it into TAM (Total Addressable Market), SAM (Serviceable Available Market), and SOM (Serviceable Obtainable Market), often by assuming you’ll capture a certain percentage of a large market. That’s why 80% of pitch deck templates still push founders toward this style of slide. The problem: it’s very easy to make the numbers look big without proving they’re realistic.
The pitfalls of top-down sizing are well-documented. Pear VC, for example, has highlighted how inconsistent definitions of TAM, SAM, and SOM lead to messy and unreliable calculations. When you lean too heavily on generalized market reports and fuzzy percentages, you miss key nuances—like how fragmented your market is, how hard certain segments are to reach, or how pricing actually works. Investors will press on those gaps the moment they see them.
Bottom-up market sizing flips the logic. Instead of starting from a big number and working down, you start from the specific segments you can serve and work up. You look at things like number of potential customers in each segment, realistic adoption rates, pricing, customer acquisition costs, and unit economics. From there, you build your TAM from the ground level. Investors tend to prefer this approach because it shows you understand how your market actually behaves and it aligns with the way early-stage VC investment memos are written and evaluated.
A concrete example comes from the construction industry. Rather than saying “construction is a multi-trillion-dollar industry” and claiming a tiny percentage of it, you can break it down: the industry includes around 700,000 firms and over 8 million employees. That granular view lets a startup targeting, say, mid-sized contractors or specific trades build projections based on real segment counts, realistic pricing, and plausible adoption. It turns hand-wavy market slides into defensible, operator-level thinking.
In the end, top-down sizing might be quicker for filling a slide, but bottom-up sizing gives you what actually matters in an early-stage VC meeting: accuracy, credibility, and a clear, evidence-based story about how your startup captures real demand.
Why Market Sizing Is Crucial for Startups
Understanding the size of your target market is a foundational step for any startup that wants to scale with intention rather than guesswork. Accurate market sizing does more than decorate a slide; it validates your business model, shows whether the opportunity is worth pursuing, and highlights how big your venture can realistically become.
When you quantify demand for your product or service, you can make sharper decisions about what to build first, how to price it, and where to focus your limited resources.
From an investor’s perspective, bottom-up TAM is increasingly treated as the only version that really counts. Sramana Mitra points out that “almost all entrepreneurs” claim a billion-dollar TAM, and that many of these numbers are chronically inflated because they lean on vague, top-down industry figures.
Her argument is blunt but accurate: bottom-up TAM analysis is the only type that truly matters to investors, while high-level, top-down TAM slides are generally irrelevant unless they are backed by a credible view of who your customers are and what they will actually pay.
Investors are particularly drawn to startups with robust market estimates. Data-driven insights provide clarity during pitches, showcasing the startup’s ability to thrive in a competitive space. Moreover, credible market sizing feeds into perspectives on venture outcomes, as detailed in the VC exits discussion that examines strategic pathways for founders.
How Bottom-Up Market Sizing Improves Forecast Accuracy
Bottom-up market sizing builds estimates using granular, real customer data, ensuring precise forecasts for startups.
1. Enhanced Precision Through Granular Data
Bottom-up market sizing relies on real-world customer data, such as purchase patterns and demographic segmentation, to create forecasts that are grounded in reality. By focusing on individual customer behaviors, businesses can avoid overgeneralized assumptions and instead produce highly accurate projections.
2. Tailored Insights for Niche Markets
This approach is especially effective for startups targeting niche or emerging markets. Tailored segmentation ensures that forecasts are relevant to specific market conditions, helping businesses identify opportunities that might otherwise be overlooked.
3. Flexibility for Growth Adjustments
The bottom-up method allows for dynamic adjustments based on growth projections or changing market conditions. This flexibility ensures that forecasts remain relevant and adaptable, even as business goals evolve.
4. Transparency That Builds Investor Confidence
Transparent financial assumptions are a cornerstone of the bottom-up approach. By clearly outlining the data sources and methodologies used, businesses can instill confidence in investors. The numerical clarity provided by your market analysis finds a parallel in the private equity waterfall model, where profit distribution methodologies are outlined.
This approach not only enhances forecast accuracy but also aligns with investor expectations for realism and transparency, making it a preferred choice for startups seeking funding.
Triangulate Market Size with Dual Approaches
Building on the importance of transparency, startups can further strengthen their forecasts by triangulating market size estimates. This approach involves combining bottom-up calculations with top-down industry data, allowing founders to cross-validate projections.
By leveraging both granular customer insights and broad market trends, startups present a more credible and defensible market opportunity. This dual-method strategy reassures investors that estimates are both realistic and grounded in multiple sources.
Follow This Step-by-Step Guide to Calculate Market Size
Understanding market size is essential for startups seeking funding or businesses planning strategic growth. A bottom-up approach to market sizing offers precision by focusing on actionable segments and real-world data. This guide breaks down the process into manageable steps, ensuring you can build a defensible market model.
This step-by-step guide will help you apply bottom-up market sizing to build a defensible market model.
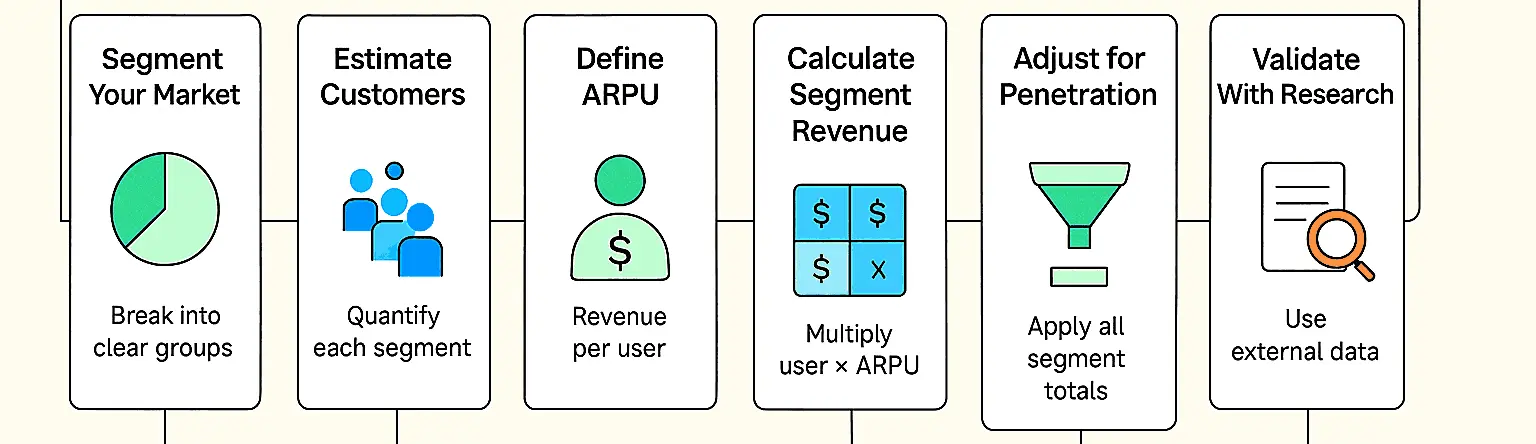
Step 1: Segment Your Target Market
Start by dividing your market into distinct, actionable segments. This segmentation can be based on demographics, geography, or industry verticals. For example, Eurostat Data provides government-sourced statistics that can help identify demographic or industry figures relevant to your calculations. Breaking the market into smaller segments enhances forecast accuracy and ensures that each segment is analyzed independently.
Step 2: Estimate the Number of Potential Customers
Once you’ve identified your segments, estimate the number of potential customers within each. Crunchbase is an excellent resource for identifying and quantifying potential business customers in specific market segments. For instance, if targeting B2B leads, Crunchbase can provide detailed insights into companies operating within your chosen industry.
Step 3: Determine Average Revenue Per User (ARPU)
Average Revenue Per User (ARPU) is a critical metric in market sizing. It represents the average revenue generated per customer within a segment. To calculate ARPU, consider factors such as pricing models, subscription fees, or average transaction values. For example, if a segment consists of 5,000 customers with an ARPU of $200, the segment revenue would be $1 million.
Step 4: Calculate Individual Segment Revenue
Multiply the estimated number of customers by the ARPU for each segment to determine its revenue potential. This step builds the foundation of your market model. For instance, targeting doctors in 175 hospitals, where 80 doctors use an application at an average selling price of $3,500 per doctor per year, results in an initial $50M market.
Step 5: Sum Segment Revenues to Derive Total Market Size
Combine the revenue calculations from all segments to arrive at the total market size. For example, if one segment generates $1 million and another $500,000, the total market size would be $1.5 million. This aggregation provides a holistic view of the market opportunity.
Step 6: Adjust for Market Penetration and Growth
Finally, refine your calculations by accounting for market penetration and growth rates. Not every potential customer will adopt your product or service immediately. For instance, partial penetration of a $5M Serviceable Addressable Market (SAM) might result in a more realistic Service Obtainable Market (SOM) figure. Referencing resources like Gartner can help refine each segment’s size and potential revenue based on industry trends and customer demographics.
Validate Your Market Size Estimates
After adjusting for market penetration and growth, founders should validate their market size estimates using secondary research. This process involves cross-checking calculations against reputable industry reports and market analyses. Validating with external sources ensures your projections are realistic and credible to investors. Incorporating this step reduces the risk of overestimating market opportunities and strengthens your overall fundraising narrative.
Case Studies and Validation
A leading startup accelerator highlights outcomes of rigorous validation. Y Combinator unicorn cohort produced at least 78 unicorns by 2024, representing 5.8% of startups from these cohorts. Their data-driven approach demonstrates how granular market sizing and validation drive measurable success rates.
For instance, the World Food Programme’s digital marketplace pilot in Zambia, built with SocialCops, started with 50 lead farmers and nearly 1,200 follower farmers using the app to trade pulses before expanding to tens of thousands of farmers.
Note: Bottom-up sizing may be less accurate for highly fragmented markets or where customer data is scarce.
Create a Market Size Slide That Impresses Investors
A compelling market size slide can transform your investor pitch by showcasing your company’s growth potential with precision. Using visual representation, segmented market data becomes easier to digest, helping investors quickly grasp complex calculations.
Clear segmentation ensures investors understand the scope of your target audience, while strategic pricing highlights revenue opportunities. Expansion strategies, when visually mapped, emphasize scalability and long-term viability. Updated regulations, such as those driving granular reporting requirements, further underscore the importance of a bottom-up approach to market sizing.
Insights from market sizing echo in the PCAP statement private equity, where data-driven approaches clarify compliance and reporting practices. A well-crafted slide not only informs but also inspires confidence in your business strategy.
Strengthen Investor Trust with Clear Market Insights
Accurate market sizing is a cornerstone of effective startup fundraising because it gives investors something concrete to believe in. When you use a bottom-up approach to show how many customers you can realistically reach and what they will pay, you replace vague optimism with precise data. That precision is what builds investor confidence and positions you as a founder who understands the real dynamics of their market, not just the headline numbers.
These insights should show up consistently wherever investors interact with your company. When detailed market data is woven into your investor CRM, pitch deck, and secure data room, your narrative about growth potential stays aligned across every touchpoint. For example, if you are building in smart healthcare, illustrating the global smart healthcare market at $144 billion in 2019 helps frame the scale of opportunity you are targeting and gives investors a benchmark for how big the space already is.
You can also use large, familiar industries as reference points to underscore opportunity size. The global apparel market reached $1.84 trillion in 2025, with projections to surpass $2 trillion by 2028. Anchoring your positioning against markets of that scale helps investors quickly understand why your category attracts capital and how big the upside can be if you execute well.
At the same time, you need to avoid turning big numbers into lazy math. A simple top-down statement like “we’ll capture 10% of a $144 billion market, so our opportunity is $14 billion” may sound exciting, but it raises immediate questions about feasibility. Investors will want to know how you get there: which segments, at what price points, with what adoption rates. This is where robust, bottom-up TAM work becomes essential.
Conclusion
Bottom-up market sizing forces you to prove your opportunity with real customers, not vanity industry numbers. By segmenting your market, counting actual buyers, and tying ARPU to each segment, you turn fuzzy “billion-dollar TAM” claims into concrete revenue paths.
Layering this with selective top-down data and external validation gives investors both scale and credibility, so your market slide survives hard questioning. It also feeds clean inputs into your pricing strategy, go-to-market plan, and fundraising story, keeping every artifact consistent.
If you’d rather not wrestle with spreadsheets alone, plug this framework into our financial model creation services and convert your bottom-up assumptions into investor-ready forecasts, scenarios, and dashboards you can confidently defend in the next partner meeting.
Key Takeaways
- Bottom-up market sizing builds TAM, SAM, and SOM from real customer segments instead of vague industry totals.
- Investors trust bottom-up models more because they show realistic adoption, pricing, and unit economics.
- Top-down sizing is fast for storytelling but often inflates numbers and collapses under investor scrutiny.
- Segmentation + customer counts + ARPU are the core building blocks of defensible market forecasts.
- Adjusting for penetration and growth turns theoretical market size into credible revenue scenarios.
- Triangulating bottom-up numbers with selected top-down data strengthens your investor narrative.
- Clear, validated market sizing makes your pitch deck, CRM, and data room feel aligned and investable
Frequently asked Questions
Why is bottom-up market sizing more accurate for startups?
Bottom-up market sizing uses real customer data and granular segmentation. This results in more precise TAM estimates and stronger credibility with investors.