


Table of Contents
Understanding the right performance metrics is essential for startups aiming to secure investor interest and achieve sustainable growth. Investors rely heavily on key performance indicators (KPIs) to evaluate a startup’s potential, and these metrics evolve as the business progresses through different stages. From early traction to scaling operations, each phase demands a unique focus on business performance metrics that highlight growth, efficiency, and market fit.
This guidance draws from deep industry analysis. Over nine years, 5,000 private B2B software companies surveyed underlines the breadth of data driving these benchmarks. The continual expansion of dataset coverage reflects shifting priorities in measuring startup growth. For founders, this means adopting actionable, evidence-based metrics at every stage.
Let’s jump right in!
Essential Startup Metrics You Need to Know
Startup metrics serve as the backbone of decision-making, offering quantifiable insights into a business's health and growth potential. These performance metrics are not just numbers—they are critical indicators that help founders, stakeholders, and investors understand whether a startup is on the right trajectory. For entrepreneurs aiming to secure funding or scale operations, understanding these metrics is essential.
Why Metrics Matter
Clear and actionable metrics provide a snapshot of how a startup is performing across key areas like revenue, customer acquisition, and profitability. For founders, these metrics validate growth potential and market positioning, ensuring that their business model is sustainable. Investors, on the other hand, rely heavily on these indicators to assess risk and scalability before committing capital.
Revenue trends and unit economics are particularly important. They reveal whether a startup can generate consistent income while maintaining manageable costs. Without these insights, it becomes challenging to make informed decisions about scaling or pivoting.
In recent industry surveys, 83% of startups cited personal motivation or values alignment as their main reason for focusing on impact metrics. This trend demonstrates how performance indicators can reflect broader strategic priorities, not just financial outcomes.
Your analysis of startup metrics is broadened by insights from startup fundraising strategies, which place these performance indicators within the wider context of capital acquisition.
Standardizing Metric Definitions for Clarity
Building on the importance of actionable metrics, founders should standardize definitions for every key performance indicator they track. Consistent terminology prevents confusion across teams and ensures investors interpret data as intended. This practice reduces the risk of miscommunication, especially when sharing updates or pitching for funding. Standardization also streamlines internal analysis, making it easier to compare performance over time and across departments.
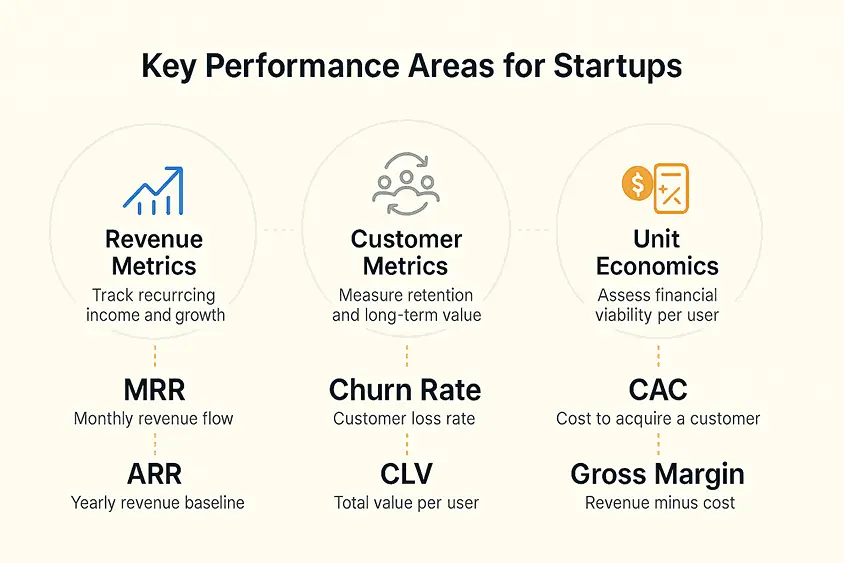
Startup metrics typically fall into several categories:
- Revenue Metrics: These include Monthly Recurring Revenue (MRR—regular income a startup receives each month) and Annual Recurring Revenue (ARR—regular income over a year) track income consistency and growth.
- Customer Metrics: Churn rate and Customer Lifetime Value (CLV) highlight customer retention and profitability.
- Unit Economics: Metrics like Customer Acquisition Cost (CAC—the average cost to acquire a new customer) and Gross Margin (sales revenue minus the cost of goods sold) help evaluate viability.
Assess Your Startup’s Financial Health with Revenue, Burn, and Unit Economics
Understanding your startup’s financial health begins with analyzing key performance metrics. These indicators—revenue trends, burn rate, and unit economics, offer a clear picture of your business’s growth trajectory and sustainability.
Revenue and Profit Margins
Revenue trends are a cornerstone of business performance metrics. Tracking Total Revenue not only highlights your startup’s growth but also builds investor confidence. For example, showcasing consistent revenue increases in pitch decks or investor updates demonstrates your ability to scale effectively. Additionally, profit margins provide insight into operational efficiency, helping you identify areas to optimize costs while maintaining profitability.
Top performers set clear benchmarks for growth. Among startups with less than $1M ARR, top quartile growth rates reached 300% year-on-year. This rapid scaling highlights how strong revenue momentum signals effective market fit and operational discipline.
Burn Rate and Cash Runway
A controlled Cash Burn rate is essential for fiscal responsibility. Investors often assess burn rate to gauge how efficiently your startup utilizes its resources. Pair this with Runway Time metrics to set clear milestones before the next funding cycle. For instance, calculating your cash runway ensures you have sufficient time to achieve key objectives, reducing the risk of financial instability.
Across surveyed SaaS companies, the median growth rate is 25%. Establishing a controlled burn rate ensures alignment with healthy, sustainable growth trajectories reported by the sector's leading firms.
Unit Economics: LTV/CAC Ratio
Unit economics, particularly the LTV/CAC Ratio, are vital for evaluating long-term sustainability. A healthy ratio—ideally greater than 3—signals profitable growth potential. Highlighting this metric in pitch decks can demonstrate your startup’s ability to acquire customers cost-effectively while maximizing their lifetime value. Case studies like Le Tote Case illustrate how improving profitability metrics directly influences investor confidence, reinforcing the importance of strong unit economics.
Maximize Customer Value with Acquisition, Lifetime Value, and Retention Strategies
Key customer metrics include customer acquisition cost (CAC—the average cost to acquire a new customer), customer lifetime value (CLV), churn rate, and net promoter score (NPS, a measure of customer loyalty via likelihood to refer others). These provide actionable insights for retention.
Lowering Acquisition Costs for Greater Efficiency
Reducing acquisition costs is a clear indicator of efficient resource allocation and strong market traction. For example, businesses can show prospective investors how they control and reduce CAC over time, demonstrating their ability to attract customers without overspending. Lower CAC paired with higher CLV signals a healthy balance between customer acquisition and retention efforts.
Distinguishing Paid vs. Blended CAC
Expanding on acquisition cost efficiency, founders should calculate both paid and blended customer acquisition costs separately. Paid CAC focuses only on direct marketing spend, while blended CAC includes organic and referral channels. This distinction reveals which strategies deliver the highest return on investment. It also enables more precise resource allocation and supports transparent communication with investors.
Maximizing Customer Lifetime Value
Customer lifetime value is a critical metric for offsetting initial acquisition costs. By focusing on strategies that increase CLV, businesses can ensure long-term profitability. Demonstrating how maximizing CLV offsets initial acquisition costs is a powerful way to highlight the importance of retaining high-value customers.
Addressing Churn Rates
High churn rates often indicate underlying product-market fit issues that require immediate attention. Monitoring churn rates helps identify customer attrition problems and potential revenue leaks. Including churn rate analysis in monthly stakeholder updates can showcase retention progress and the effectiveness of customer engagement strategies.
Leveraging Net Promoter Score for Growth
Net promoter score provides valuable insight into customer satisfaction and referral potential. A high NPS reflects strong customer loyalty and the likelihood of organic growth through referrals. This metric can guide businesses in refining their customer experience to foster long-term relationships.
Boost Engagement with Activation, Retention, and Adoption Tactics
Effective product engagement starts with understanding key performance metrics. Activation rates, retention trends, and feature adoption speed are critical indicators of how well your product resonates with users.
A high activation rate reflects a seamless onboarding experience, ensuring new users quickly grasp the value of your product. This initial success sets the stage for long-term engagement. Retention, on the other hand, is the backbone of sustainable revenue. By keeping users engaged over time, businesses can reduce churn and build lasting relationships.
Tracking the adoption of new features provides valuable insights into product-market alignment. Rapid adoption signals that your updates meet user needs and enhance their experience. These metrics collectively serve as essential business performance indicators, helping you refine strategies and validate your product’s fit in the market.
Understanding these metrics is not just about numbers—it’s about creating meaningful user experiences that drive growth.
Drive Growth with Year-over-Year Trends, MRR, and Viral Coefficients
Understanding growth metrics is essential for scaling a business effectively. Stable year-over-year (YoY) growth and consistent monthly recurring revenue (MRR) are key indicators of predictable revenue streams, which are highly attractive to investors. These metrics provide a clear picture of business performance, bridging early-stage traction with long-term scalability.
The Power of Predictable Revenue Streams
Year-over-year growth reflects how well a business sustains its momentum over time. A steady increase in MRR, for instance, demonstrates the reliability of recurring income, reassuring stakeholders about the company’s financial health. Companies like Azure Cap exemplify how investor-led traction depends on demonstrated growth metrics, making them a cornerstone of strategic scaling decisions.
Viral Coefficients: Unlocking Exponential Growth
Real-world viral strategies showcase exponential results. Dropbox leveraged an 'invite a friend, get storage' referral strategy to scale from 100,000 to 4 million users in just 15 months. Their approach demonstrates how viral coefficients can transform user acquisition, driving rapid market adoption and sustained traction.
A viral coefficient greater than 1 signals exponential user growth, where each customer brings in more than one new user. Viral loops in user acquisition amplify this effect, creating a self-sustaining growth cycle. Highlighting viral growth potential, such as the strategies employed during the Windward Exit, showcases how high-growth metrics can attract acquisition interest and drive market expansion.
Acquisition, Retention, and the North Star Metric
Acquisition and retention rates are equally critical. While acquisition measures how effectively a business attracts new customers, retention reflects its ability to keep them engaged. Together, these metrics align with the North Star metric, a single, overarching indicator of success that guides strategic decisions.
Fine-Tune Marketing with Conversion Rate and CPA Insights
Understanding the effectiveness of your marketing campaigns starts with analyzing key performance metrics. Conversion rates, for instance, reveal how well your campaigns are driving desired actions, such as purchases or sign-ups, and directly impact revenue generation. A high conversion rate signals that your marketing funnel is optimized, while a low rate may indicate inefficiencies that need attention.
Equally important is the cost per acquisition (CPA), which measures the financial efficiency of acquiring new customers. A declining CPA suggests improved marketing strategies and a higher return on investment (ROI). Monitoring these metrics allows businesses to align their marketing spend with tangible results, ensuring resources are allocated effectively.
A consideration of startup funding options enriches your review by explaining how various financing methods influence the metrics that capture investor attention.
By focusing on these business performance indicators, you can refine your strategy to maximize campaign success and profitability.
Get Actionable Insights to Choose KPIs and Solve Key Challenges
Identifying the right performance metrics is critical for startups aiming to address operational gaps and meet investor expectations. Overcoming data overwhelm starts with focusing on tailored KPIs that align with specific business goals. Using frameworks like SMART KPIs ensures teams remain focused on measurable outcomes, driving clarity and efficiency.
Avoiding Vanity Metrics in KPI Selection
Building on the importance of tailored KPIs, founders should avoid vanity metrics that do not reflect meaningful progress. Metrics like social media followers or app downloads may look impressive but often lack direct business impact. Instead, focus on KPIs that drive measurable outcomes and align with strategic objectives. This approach ensures resources are directed toward initiatives that truly support growth and investor confidence.
Expert insights, such as those from Efrat Kasznik, president of Foresight Valuation Group, highlight the importance of pinpointing essential KPI inputs.
Monitor Monthly Growth and Analyze Churn Effectively
Tracking monthly performance metrics is essential for understanding business dynamics. Short-term tracking, such as Month-over-Month (MoM) growth, highlights trends and operational shifts, enabling businesses to detect early declines or acceleration in user sign-ups. Tools like Baremetrics simplify this process by automating monthly performance reporting for SaaS companies.
Timely churn analysis is equally critical, as it can uncover customer retention issues that demand immediate attention. Prioritizing these insights ensures businesses stay agile and responsive to evolving challenges.
Your Comprehensive Guide to Startup Metrics
Startup metrics are the backbone of informed decision-making, offering insights into performance metrics that drive growth. This section organizes the guide into distinct areas, from understanding essential business performance metrics to tracking business performance indicators effectively. Readers can quickly pinpoint sections that align with their interests, ensuring a seamless exploration of the multifaceted approach to startup metrics analysis.
By structuring the content into clear, digestible segments, this guide empowers entrepreneurs to focus on the metrics that matter most to their unique business goals. Whether you're seeking clarity on financial indicators or operational benchmarks, this roadmap simplifies the journey.
Conclusion
Crafting a compelling pitch deck requires a blend of storytelling and data-driven insights. Throughout this blog, we’ve explored strategies to ensure your pitch deck not only captures attention but also builds credibility. From structuring a clear narrative to showcasing performance metrics, every element plays a vital role in persuading potential investors.
A well-designed pitch deck is more than just slides; it’s a tool to communicate your vision and validate your business potential. By focusing on clarity and aligning your narrative with solid metrics, you can create a presentation that resonates with your audience and drives results.
Our Investor Outreach service is designed to help you craft compelling narratives and present data-backed strategies that inspire confidence. If you're ready to take the next step in connecting your vision with the right investors, we can help.
Key Takeaways
- Startup performance metrics validate growth potential and build investor confidence.
- A balanced framework of financial, customer, product, growth, and marketing indicators drives strategic decisions.
- Tracking burn rate, LTV/CAC, and viral coefficient can sway fundraising outcomes.
- Real-life case studies and expert insights show how to integrate these metrics effectively.
- Tailored dashboards turn raw data into visual, actionable insights for investors.
Frequently asked Questions
What are the most important startup KPIs for early-stage funding?
For early-stage funding, key startup KPIs include revenue growth, burn rate, customer acquisition cost, and retention metrics. Investors use these to assess potential.