


Table of Contents
For investors evaluating a startup acquisition, financial performance often separates a fast, clean deal from a costly missed opportunity. Storytelling and product market fit still matter, but acquisition decisions rely on clear, quantifiable proof that the startup enhances strategic value. Knowing which financial metrics move the needle is essential for investors who must price risk and allocate capital confidently.
Recent research suggests 67 percent of ventures fail because teams chase vanity metrics instead of validated learning and financial discipline. For acquirers, this highlights why rigorous decision grade metrics are mission critical and why sloppy data can poison post deal outcomes.
The stakes are significant, because buying a startup means inheriting its revenue engine, cost structure, risk profile, and future potential. Headline metrics like revenue growth and gross margin provide a quick health check, but they rarely tell the full acquisition story.
This guide helps investors separate signal from noise by focusing on the acquisition stage metrics that predict durable value creation. It outlines how to interpret these numbers in context, so every prospective deal is evaluated with discipline and clarity.
Why Financial Metrics Should Matter to As an Investor
For investors, the core objective of any early stage bet is a meaningful return within a defined time frame.
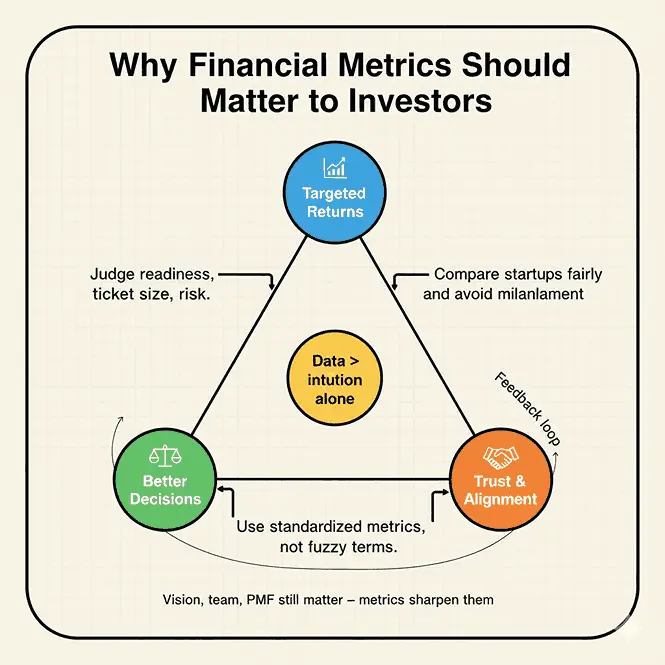
Before committing capital, investors focus on revenue growth, gross margin, burn rate, runway, lifetime value, CAC, churn, cash flow, and EBITDA. Mastering these metrics enables investors to judge readiness for funding and helps strong startups pass due diligence and attract offers. Because decisions rely on objective data, investors should insist that every financial metric follows clear, standardized definitions across all materials.
Confusing terms such as treating bookings like revenue creates distorted expectations and immediately undermines trust in the reported numbers. Consistent definitions allow investors to compare startups accurately, make informed decisions, and avoid misalignment during negotiation and ongoing portfolio management. Clear shared definitions also streamline due diligence and support transparent communication between investors and founders throughout the investment process.
Vision, team quality, and product market fit remain critical, but data grounded investment decisions often outperform those driven by intuition. Financial metrics provide objective, quantifiable indicators of a startup's traction, efficiency, risk profile, and capacity to scale with new capital.
Investors use these metrics to judge whether a venture is ready for capital, what funding is justified, and associated risk. Poor or unclear financials are a red flag for sophisticated investors and transparent, prepared metrics build trust and confidence instantly.
Your exploration of user-growth and retention metrics benefits from the broader context provided by startup scouting strategies, which outlines comprehensive approaches for early-stage investment analysis.
Startups like yours already closed their rounds with us.
Founders across every stage and industry. Here's what it took.
- Raised $7.6M for Swiipr Technologies
- Raised $0.5M for Ap Tack
- Raised €0.5M for Ivent Pro

The Core Financial Metrics Investors Scrutinize
A 2024 Gillion report found startups that systematically track core metrics grow 20% faster than those who do not. This highlights why data-driven approaches outperform intuition in investment decision-making. Here are the core metrics which investors look for before acquisition:
1. Revenue Growth
For SaaS startups, Gross Revenue Retention remains steady around 92% for $1M–$5M ARR. This sets a clear benchmark for evaluating healthy customer stickiness and revenue durability.
Revenue is the most direct indicator of market traction, proof that people are willing to pay for a product or service. Investors focus on:
- Current annual or monthly recurring revenue (ARR/MRR) figures
- Growth rates (month-over-month, year-over-year)
- Distribution of revenue across customers, geographies, and products
- Revenue concentration risk (i.e., reliance on a few customers)
Sustained, healthy revenue growth signals market demand and a functioning sales strategy. Flat or highly volatile growth is a warning sign. It may suggest product-market fit is still lacking.
2. Gross Margin
Gross margin measures how much is left from sales revenue after covering the direct costs of delivering the product or service.
- Gross Margin = (Revenue – Cost of Goods Sold) / Revenue
A strong gross margin suggests room for future profitability. Razor-thin margins may indicate structural problems or a highly competitive environment.
3. Burn Rate and Runway
- Burn Rate is the rate at which a startup spends its capital.
- Runway indicates how long the company can continue operating at the current burn rate before needing additional cash.
Both metrics are vital risk management tools. Investors want to know:
- The “cash out date”, when the startup will run out of money without new funds
- The match between company milestones and available capital
Better-managed burn and longer runway show financial discipline and mitigate the risk of unplanned down rounds or business distress.
4. Customer Acquisition Cost (CAC) and Lifetime Value (LTV)
- CAC: The total sales and marketing cost to acquire a single customer.
- LTV: The net profit attributed to a customer over their entire relationship with the company.
Investors analyze the LTV/CAC ratio to answer a foundational question: Does the company generate more value from a customer than it costs to acquire them?
- LTV/CAC > 3 is generally considered healthy for scalable startups.
- A ratio below 1 spells trouble—growth could actually destroy value.
5. Churn Rate
For subscription or recurring-revenue businesses, churn rate (the percentage of customers or revenue lost over a period) is essential.
- High churn suggests poor product-market fit or weak customer service.
- Low or improving churn means strong customer loyalty and long-term potential.
6. Cash Flow and Operating Expenses
Whether a company is “cash-flow positive” is perhaps the most telling sign of financial resilience, especially in tough funding climates. Investors look closely at:
- Operating cash flow (does the core business produce enough cash to cover its expenses?)
- Operating expenses breakdown (salaries, R&D, marketing, general admin)
- Trends in spending efficiency as revenues grow
7. Profitability (Gross, EBITDA, Net Margins)
Profitability metrics come in several forms:
- Gross margin (as above) focuses on core operating efficiency.
- EBITDA (Earnings Before Interest, Taxes, Depreciation, and Amortization) margin is used for more mature startups, providing insight into recurring earnings from daily operations.
- Net margin illustrates how much of total revenue becomes bottom-line profit.
While early-stage companies are often not profitable, understanding the timeline and pathway to profitability is essential.
Debt Levels and Capital Structure
How much debt (vs. equity) is used to finance operations impacts risk and flexibility.
- Debt-to-equity ratio shows how heavily leveraged the company is.
- High debt can restrict future fundraising, signal financial distress, or lock in interest obligations that threaten runway.
Investors tend to prefer lower debt at earlier stages, opting for greater financial resilience as the company scales.
Unit Economics
Unit economics refer to the direct revenues and costs associated with a single “unit” of product or service sold. Strong unit economics suggest a repeatable, profitable growth engine; poor unit economics mean that each additional sale puts the business further in the red.
Beyond understanding each metric, founders should focus on a concise set of KPIs that best reflect their business model and stage. Too many metrics can dilute the impact of key insights and confuse investors. Selecting 5 to 7 core metrics ensures clarity, aligns with investor expectations, and supports more effective decision-making. This targeted approach also streamlines internal tracking and reporting.
For a deeper dive into how metrics can shape decision-making, insights into user engagement integrate seamlessly with the discussion in metrics-for-startup-scouting-success, which provides a quantitative framework for evaluating the effectiveness of scouting methods.
Secondary Metrics and Contextual Indicators
While the above metrics are central, sophisticated investors also consider:
- Revenue concentration risk: Overreliance on a single customer or a small group, which can threaten stability if those customers leave.
- Accounts receivable/payable cycles: Slow collections or payment delays can drain cash and signal operational inefficiencies.
- Break-even analysis: When will the company’s revenues cover its expenses?
- Working capital: The difference between current assets and current liabilities, a measure of near-term liquidity.
- Cap table health: Is equity evenly distributed among active founders, or are there messy splits, excessive option pools, or potential control issues?
How Investors Use Financial Metrics in the Decision Process
1. Establishing Baseline Credibility
Founders who know and can clearly explain their financial metrics stand out to investors. It signals operational maturity, accountability, and strategic discipline. Conversely, vague or evasive answers quickly end investor interest.
2. Validating the Business Model
Metrics help investors avoid businesses where “growth” simply means scaling losses. High customer acquisition costs, poor retention, or weak unit economics mean that more sales will not translate into better business results.
3. Benchmarking Against Similar Startups
Investors compare your metrics to benchmarks from similar companies—other startups in the same space, geography, or stage. Falling far outside the norm (positive or negative) raises discussion points and, potentially, deeper scrutiny.
4. Modeling Future Scenarios
Investors stress-test projections using current financials as a baseline. Even if your model shows hockey-stick growth, if it relies on unsustainable burn or unrealistic improvements in unit economics, it won’t pass muster.
Financial Metrics by Stage: Early vs. Growth-Stage
Not all numbers matter equally at every stage. Here’s how priorities shift:
Early-Stage (Seed, Pre-Series A)
- Focus: Market validation, initial customer traction, burn rate, and runway.
- Key metrics: MRR/ARR, gross margin, CAC, runway.
- Emphasis is on proving a repeatable business model rather than hitting large revenue targets.
Growth-Stage (Series A and Beyond)
For growth-stage SaaS, median burn multiples of 1.6× highlight expected capital efficiency. Investors watch growth rates, margins, and responsible resource allocation closely.
- Focus: Scalability, efficiency, and profitability.
- Key metrics: Growth rates, LTV/CAC, EBITDA, net margin, churn.
- Investors expect clear, upward trends in both revenues and retention along with disciplined spending.
Red Flags and Pitfalls Investors Watch For
- Poorly tracked or inconsistent data
- Unrealistic financial projections and “hockey-stick” forecasting with no historical precedent
- High, unexplained monthly burn with little traction
Edge Case: Some capital-intensive sectors (hardware, biotech) will have high burns by necessity; explain context and capital plan to investors.
- Negative unit economics that worsen as sales scale up
- Overly optimistic assumptions, especially on customer retention or market penetration
- Opaque cap table with unclear founder or investor stakes
How Startups Can Prepare for Investor Scrutiny
To impress investors and increase the odds of a successful raise:
- Maintain regularly updated, accurate, and GAAP-compliant financial statements.
- Track and understand all core financial metrics and be ready to explain changes or fluctuations, good or bad.
- Use benchmarks from your industry to contextualize your performance.
- Prepare a clean, transparent cap table and clear documentation around equity and options.
- Build a sensitivity analysis showing “what if” scenarios for sales, costs, and market changes.
- Be transparent about risks and realistic regarding timelines to profitability and cash needs.
Bullet Checklist for Founders:
- Are your monthly revenue and customer metrics growing?
- Is your CAC lower than your LTV by a healthy multiple?
- Do you have at least 12 months of runway at your current burn rate?
- Are your gross and operating margins improving over time?
- Are your financials up-to-date, clean, and free of red flags?
- Can you quickly send investors a one-pager with your most critical financial KPIs?
- Prepare a clean, transparent cap table and clear documentation around equity and options.
- Build a sensitivity analysis showing “what if” scenarios for sales, costs, and market changes.
The Importance of Regular Metric Reviews
This foundation enables startups to identify trends and address issues before they escalate. Scheduling monthly metric reviews helps teams spot deviations from targets and adjust strategies promptly. Early detection of negative trends can prevent surprises during investor meetings. Consistent reviews also foster a culture of accountability and data-driven decision-making.
Real-World Examples of Metrics in Action
Example 1: Nubank and the power of unit economics
Nubank uses a very simple story for investors. The bank has over 90 million customers across Brazil, Mexico, and Colombia, making it the largest neobank in the world. Its monthly average cost to serve each active customer is about 0.8 dollars, while average revenue per active customer has risen from 3.6 dollars in 2020 to 7.8 dollars in 2022. Customer acquisition cost remains around 7 dollars, still far below traditional banks in its markets.
For investors, those three metrics together low cost to serve, rising revenue per customer, and low acquisition cost tell a clear story of scalable, profitable growth rather than growth that burns cash.
Example 2: Revolut and scaling revenue per customer
Revolut shows how revenue and user metrics combine into a convincing scale narrative.
In 2024, its revenue jumped 72 percent from 2.2 billion dollars to about 4.0 billion dollars, while pre tax profit reached roughly 1.4 billion dollars. Customer numbers grew 38 percent to 52.5 million users, and total customer balances increased 66 percent to about 38 billion dollars.
Those metrics show three things investors care about strong revenue growth, improving profitability, and deeper customer engagement, as balances and product usage rise faster than headline user growth.
Example 3: Duolingo and retention as a north star
Consumer and prosumer products often live or die on retention rather than downloads. Duolingo is a good example.
The company focused on its current user retention rate as a north star metric and used it to redesign the product experience. By improving retention, Duolingo drove a 350 percent acceleration in daily active users compared to its previous growth trend.
For investors, that single metric daily active users, tied directly to retention improvements is proof that the team can run experiments, improve engagement, and compound long term value instead of relying on paid acquisition alone.
Beyond the Numbers: The Investor’s Perspective
Investors don’t just look at static numbers, they consider trends, context, and qualitative factors:
- Is there consistent improvement in key numbers over time?
- Are there logical, data-driven explanations for seasonality, fluctuations, or expense growth?
- Do the founders show financial discipline, adjusting hiring, marketing, or R&D spend when market conditions change?
Ultimately, investors want numbers that tell a believable story about the future, not just the present. The evaluation of growth metrics finds additional context in startup metrics investors track, which elaborates on performance indicators commonly observed by investors.
Conclusion
No matter how inspirational a founder’s story or how massive the market opportunity, investment decisions rely on a foundation of sound financial metrics. These numbers give investors the roadmap they need to evaluate risk, project potential returns, and feel confident putting capital at risk.
Mastering these metrics, tracking, understanding, and communicating them effectively, does more than secure funding. It sets startups up for operational discipline, strategic decision-making, and enduring business success. Whether you are a founder seeking investment or an investor preparing diligence, never underestimate the importance of the numbers before you write the first check.
At Qubit Capital, we understand the importance of connecting investors with the right startups. If you're ready to explore breakthrough opportunities, our Startup Matchmaking service is here to help. Let’s get started!
Key Takeaways
- Understanding key financial metrics empowers investors to make informed decisions before committing capital to any startup.
- Revenue growth and gross margin reflect the viability and scalability of a startup’s business model.
- Burn rate and runway are essential indicators to assess how long a startup can operate before needing additional funding.
- Customer acquisition cost (CAC) and lifetime value (LTV) provide clarity on marketing efficiency and the long-term profitability of acquired customers.
- Cash flow management and EBITDA offer insights into operational strength and the path toward sustainable profitability.
- Debt levels and capital structure directly influence a startup’s financial risk and potential investor returns.
Find startups worth your time.
Curated startup opportunities matched to your thesis and investment criteria.
- Deal flow filtered by sector, stage, and fit
- Research and context included with every opportunity
- Less noise. More relevant deal flow.

Frequently asked Questions
How do investors use unit economics when evaluating startups?
Investors examine unit economics to assess if each sale generates profit after variable costs, signaling long-term scalability and financial health.