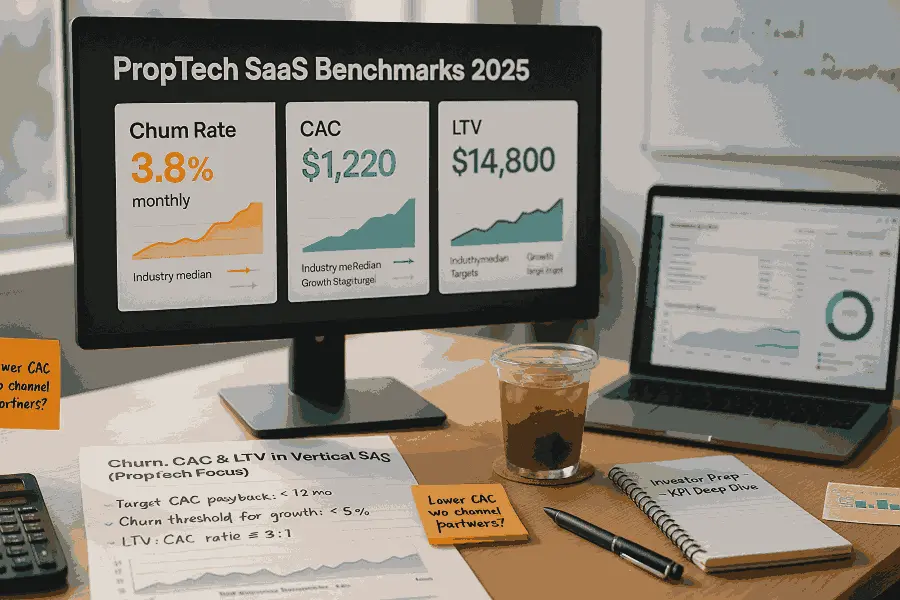
Tracking the right metrics is essential for PropTech SaaS companies aiming to scale effectively. Among these, Churn, Customer Acquisition Cost (CAC), and Lifetime Value (LTV) stand out as foundational KPIs that directly influence growth and investor confidence. Understanding these benchmarks not only helps businesses optimize their financial strategies but also ensures long-term sustainability in a competitive market.
Your discussion of financial strategy is complemented by insights found in the proptech fundraising guide, which outlines the journey from early-stage funding to advanced rounds. This broader perspective seamlessly ties into your analysis of key metrics like Churn, CAC, and LTV.
In this article, we’ll explore data-driven benchmarks, actionable strategies, and real-world examples to help PropTech SaaS companies improve retention, reduce costs, and maximize customer value. Let’s jump right in!
PropTech SaaS Churn Rate Benchmarks
Industry-Wide SaaS Baselines
The average churn rate for B2B SaaS companies stands at 3.5% monthly. This breaks down into 2.6% voluntary churn (customer-initiated cancellations) and 0.8% involuntary churn (payment failures).
However, recent data shows the average has risen to 4.2% in 2024. The key insight: churn rates have been climbing steadily, peaking at 4.4% in 2023 before stabilizing.
PropTech-Specific Churn Considerations
PropTech SaaS companies often see different churn patterns than traditional software. Real estate professionals typically evaluate software during specific seasons or transaction periods. This creates cyclical churn patterns that don't match standard SaaS benchmarks.
Target Churn Rates for PropTech:
- Excellent: Below 2% monthly churn
- Good: 2-3.5% monthly churn
- Needs Improvement: Above 5% monthly churn
The first three months remain critical for retention. Churn rates typically start at 10% in Month 1, declining to 4% by Month 3. PropTech companies should expect this pattern to be more pronounced due to complex implementations and change management requirements.
Churn Rate Variations by Customer Segment
Small Real Estate Businesses (1-10 agents/properties)
Monthly churn rates typically range from 5-8%. These customers have lower switching costs and less complex integration requirements. They're more price-sensitive and likely to churn during slow market periods.
Mid-Market Real Estate Companies (11-100 agents/properties)
Monthly churn rates generally fall between 3-5%. These customers have more invested in implementation but still maintain flexibility to switch solutions.
Enterprise Real Estate Organizations (100+ agents/properties)
Monthly churn rates typically stay below 2%. Large organizations have complex integrations, extensive training investments, and higher switching costs that naturally reduce churn.
Seasonal Churn Patterns in PropTech
Real estate markets have natural seasonality that affects PropTech churn rates. Spring and summer months typically see lower churn as transaction volumes peak. Winter months often show higher churn as businesses evaluate their technology stack during slower periods.
Seasonal Churn Expectations:
- Q1: Higher churn (budget resets, annual reviews)
- Q2: Lowest churn (peak transaction season)
- Q3: Moderate churn (mid-year evaluations)
- Q4: Higher churn (year-end cost optimization)
Customer Acquisition Cost (CAC) Benchmarks
Industry CAC Standards
The median CAC for B2B SaaS companies is approximately $205. However, this varies dramatically by industry, customer segment, and go-to-market strategy. Enterprise SaaS companies typically see CACs ranging from $500 to $15,000.
PropTech-Specific CAC Challenges
PropTech companies face unique acquisition challenges that drive higher CACs. Real estate professionals are relationship-driven buyers. They prefer referrals and demonstrations over digital marketing. This affects your acquisition cost structure significantly.
PropTech CAC Benchmarks by Segment:
| Customer Segment | Typical CAC Range | Primary Acquisition Channel |
|---|---|---|
| Individual Agents | $50-$200 | Digital marketing, referrals |
| Small Brokerages | $300-$800 | Inside sales, partnerships |
| Property Managers | $500-$1,500 | Direct sales, trade shows |
| Enterprise REITs | $2,000-$10,000 | Field sales, strategic partnerships |
CAC Calculation for PropTech
Traditional CAC calculations don't capture PropTech complexities. Long sales cycles mean costs accumulate over multiple quarters before conversion. Multi-stakeholder decisions create additional touch points and costs.
Enhanced CAC Formula for PropTech:
- Total Sales & Marketing Costs ÷ New Customers Acquired
- Include: Salaries, advertising, events, partnerships, demos
- Exclude: Existing customer expansion costs
- Track by: Customer segment, acquisition channel, time period
Geographic CAC Variations
PropTech CAC varies significantly by geography. Major metropolitan markets have higher competition and acquisition costs. Secondary markets often require more education and longer sales cycles.
CAC by Market Type:
- Tier 1 Markets (NYC, SF, LA): 40-60% higher than average
- Tier 2 Markets (Austin, Denver, Nashville): Average CAC
- Tier 3 Markets (smaller cities): 20-30% lower CAC, longer cycles
Lifetime Value (LTV) Benchmarks
SaaS LTV Fundamentals
The median LTV for B2B SaaS companies is approximately $1,500. Top-quartile companies achieve LTVs exceeding $5,000. The key drivers are monthly recurring revenue, gross margins, and retention rates.
PropTech LTV Characteristics
PropTech companies often achieve higher LTVs due to essential workflow integration. Real estate professionals using property management, CRM, or transaction management software develop strong dependencies on these tools.
PropTech LTV by Customer Type:
| Customer Segment | Average LTV | Retention Driver |
|---|---|---|
| Individual Agents | $800-$2,000 | Transaction dependency |
| Small Brokerages | $3,000-$8,000 | Operational integration |
| Property Managers | $5,000-$15,000 | Tenant/owner relationships |
| Enterprise Clients | $20,000-$100,000 | System complexity |
LTV Calculation Considerations
PropTech LTV calculations must account for expansion revenue from additional properties, users, or services. Many PropTech companies see 20-40% of total LTV coming from expansion rather than initial subscriptions.
Enhanced LTV Components:
- Base subscription revenue
- Usage-based expansion
- Additional service fees
- Integration and training revenue
- Partner referral commissions
The LTV:CAC Ratio Sweet Spot
Industry Standards
The ideal LTV:CAC ratio for SaaS companies is 3:1 or higher. Ratios below 3:1 suggest unsustainable unit economics. Ratios above 10:1 might indicate underinvestment in growth.
PropTech-Specific Considerations
PropTech companies should target LTV:CAC ratios between 4:1 and 8:1. Higher ratios account for longer payback periods and seasonal revenue fluctuations common in real estate markets.
PropTech LTV:CAC Targets:
- Minimum Viable: 3:1 ratio
- Good Performance: 5:1 ratio
- Excellent Performance: 7:1+ ratio
Payback Period Expectations
The median CAC payback period for B2B SaaS is 14 months. PropTech companies typically see longer payback periods due to implementation complexity and seasonal usage patterns.
PropTech Payback Period Benchmarks:
- Small Customers: 8-12 months
- Mid-Market: 12-18 months
- Enterprise: 18-24 months
Improving Your PropTech Metrics
Reducing Churn Through Onboarding
PropTech churn often occurs during the first 90 days due to implementation challenges. Successful companies invest heavily in white-glove onboarding for real estate professionals who may resist change.
Onboarding Best Practices:
- Dedicated customer success managers
- Industry-specific training materials
- Integration with existing workflows
- Regular check-ins during first quarter
- Success milestone celebrations
Optimizing CAC Through Channel Mix
PropTech companies achieve lower CACs by focusing on relationship-driven channels. Referrals from existing customers, partnership programs, and industry events typically outperform digital advertising.
High-ROI Acquisition Channels:
- Customer referral programs
- Real estate industry partnerships
- Trade show participation
- Content marketing for SEO
- LinkedIn social selling
Maximizing LTV Through Expansion
PropTech companies with the highest LTVs focus on land-and-expand strategies. Start with core workflows, then add complementary services as
Actionable Insights for KPI Optimization
- Invest in AI Solutions: Use predictive models to enhance churn reduction and revenue forecasting accuracy.
- Focus on Capital Efficiency: Track metrics like the capital efficiency ratio to align growth strategies with investor expectations.
- Specialize SaaS Offerings: Tailor solutions to specific verticals to boost retention and maximize LTV.
- Enhance User Experience: A UX redesign, as demonstrated by Creava Agency, can improve activation rates and transaction completion metrics, directly impacting key KPIs.
For a deeper dive into performance indicators across PropTech models, explore the proptech north star metrics, which complement this analysis by integrating foundational metrics with strategic goals.
By optimizing these KPIs, PropTech SaaS companies can drive operational efficiency, attract investor interest, and position themselves for long-term success.
Conclusion
Tracking churn, customer acquisition cost (CAC), and lifetime value (LTV) is not just about numbers; it’s about understanding the health of your PropTech SaaS business. These metrics provide a clear lens into performance, helping you identify areas for growth and improvement. By applying actionable strategies and learning from real-world case studies, businesses can optimize operations and strengthen their appeal to investors.
A data-driven approach is essential to align financial metrics with market demands and investor expectations. This ensures that your business remains competitive while fostering long-term sustainability.
If you're ready to enhance your financial strategy with proven benchmarks, let us help you secure the capital you need with our Fundraising Assistance service.
key Takeaways
- PropTech churn follows seasonal patterns with Q1/Q4 showing higher rates during budget reviews and slower transaction periods
- CAC varies dramatically from $50-200 for individual agents to $2,000-10,000 for enterprise clients, with Tier 1 markets costing 40-60% more
- Target LTV:CAC ratios of 4:1 to 8:1 are higher than standard SaaS due to longer payback periods and real estate seasonality
- Enterprise PropTech clients have sub-2% monthly churn while small businesses see 5-8% due to integration complexity and switching costs
- Relationship-driven channels like referrals and industry partnerships deliver better ROI than digital advertising for PropTech acquisition
Frequently asked Questions
What are the key KPIs for PropTech SaaS companies?
Key performance indicators (KPIs) for PropTech SaaS companies often include metrics such as Monthly Recurring Revenue (MRR), Customer Acquisition Cost (CAC), Customer Lifetime Value (CLV), and Net Revenue Retention (NRR). These metrics help gauge financial health, customer satisfaction, and overall growth potential.


