Product-led growth (PLG) has become a cornerstone strategy for many companies, particularly in the SaaS industry. With 91% of B2B SaaS companies increasing their investments in PLG, understanding how to evaluate its metrics is more critical than ever. This blog offers a structured, data-driven approach to assessing PLG metrics, helping investors and stakeholders uncover growth potential with precision.
Contextual insights from how to do startup outreach for investors offer you a broader perspective on establishing initial investor-startup connections, complementing the evaluation techniques discussed here.
We’ll explore essential metrics, their significance, and how they align with long-term growth strategies. Let’s jump right in.
What is PLG?
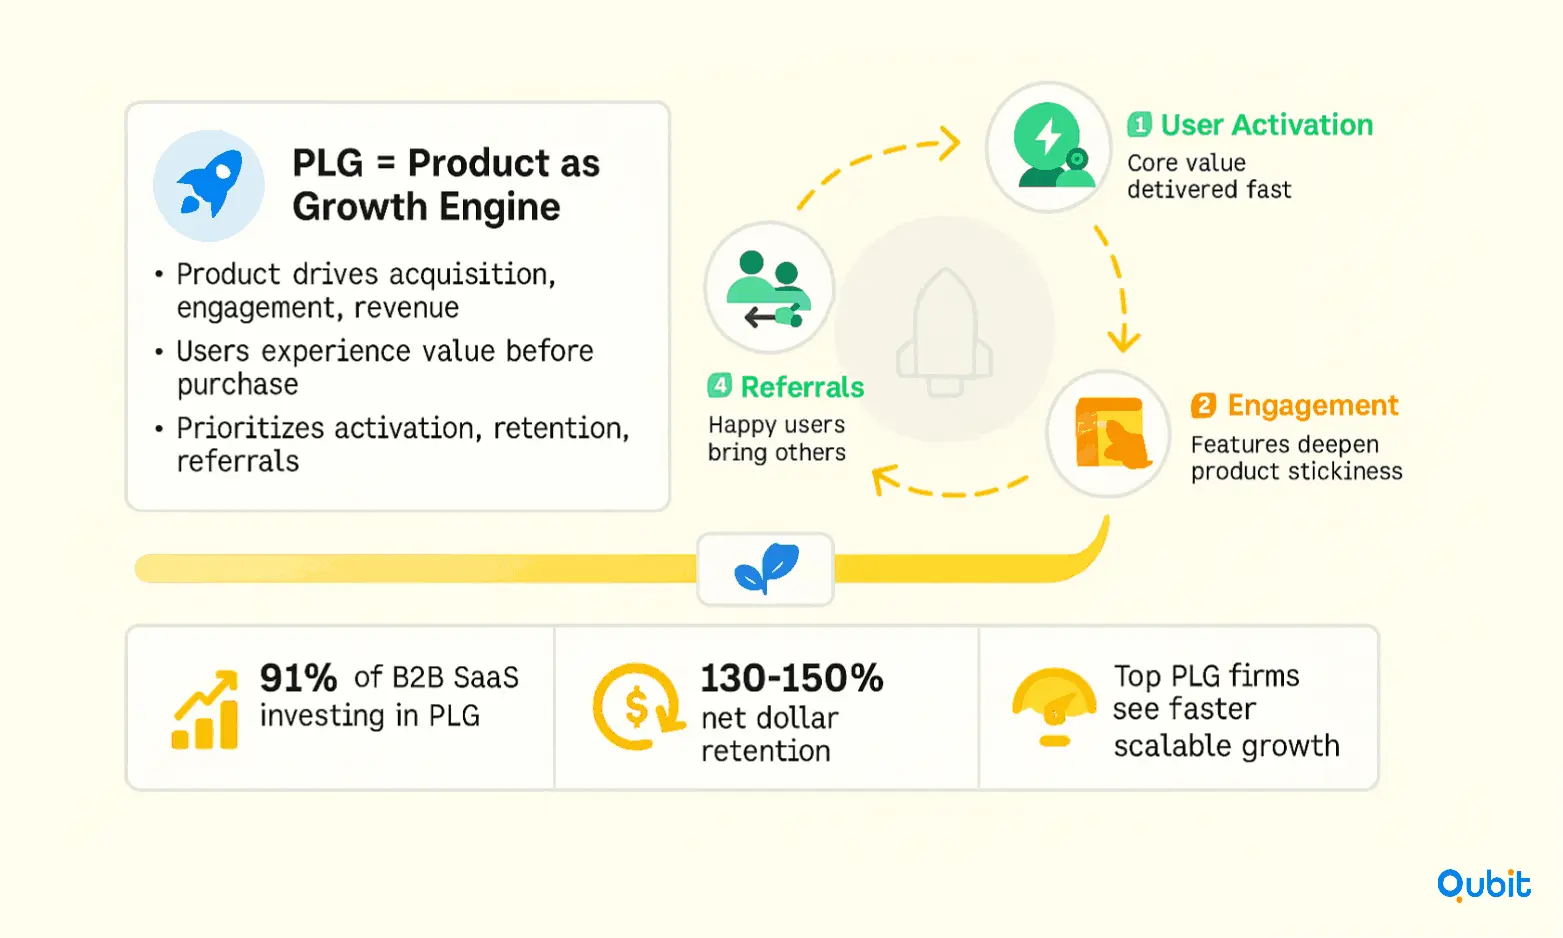
Product-Led Growth (PLG) represents a transformative approach to business strategy, where the product itself becomes the primary driver of customer acquisition, engagement, and revenue generation. Unlike traditional sales-led models that rely heavily on outbound efforts, PLG focuses on creating user-centered experiences that naturally encourage adoption and retention. This shift places the product at the heart of the customer journey, enabling users to experience its value firsthand before making a purchasing decision.

Modern PLG strategies emphasize user activation, ensuring that customers quickly realize the product's core benefits. This approach fosters organic growth as satisfied users share their experiences, driving referrals and expanding the customer base. Research underscores the growing importance of PLG, with 91% of B2B SaaS companies increasing their investments in this strategy. The results speak for themselves—top-performing PLG companies often achieve impressive net dollar retention rates of 130-150%, highlighting the model's ability to drive sustainable growth.
As businesses increasingly pivot from sales-led to product-led metrics, the focus shifts toward measuring user activation, engagement, and retention. This evolution reflects an industry-wide recognition of the product's role as a growth engine.
PLG is not just a strategy; it's a mindset that prioritizes delivering value through the product itself. By aligning the product experience with user needs, companies can create a self-sustaining growth loop that benefits both the business and its customers.
PLG and PLS Models
Product-led growth (PLG) and product-led sales (PLS) represent two distinct yet complementary approaches to driving business growth. PLG focuses on a self-service, user-driven model, while PLS introduces targeted sales strategies to maximize conversions, particularly for high-value prospects. Companies like Canva, Loom, and Spotify have successfully implemented variations of these models, showcasing their adaptability and impact.
Exploring PLG Models
PLG models are designed to let the product speak for itself, enabling users to experience its value firsthand. Three common approaches within PLG include:
- Freemium: This model offers a basic version of the product for free, with premium features available through paid plans. Spotify exemplifies this strategy, enticing users with free access while encouraging upgrades for ad-free listening and offline downloads.
- Free Trial: Here, users gain temporary access to the full product, allowing them to explore its capabilities before committing to a purchase. Asana’s free trial upsell strategy demonstrates how businesses can effectively convert trial users into paying customers by highlighting the product's value during the trial period.
- Reverse Trial: Unlike the traditional free trial, this approach starts users with premium features for a limited time before transitioning them to a free version. This method encourages users to experience the full potential of the product, increasing the likelihood of upgrading.
Introducing Product-Led Sales
While PLG thrives on self-service, PLS adds a layer of strategic sales engagement to the mix. This approach identifies product-qualified leads (PQLs)—users who demonstrate strong buying intent through their product usage. For instance, when multiple users collaborate within a tool like Airtable, it signals a potential sales opportunity. These triggers, such as when usage surpasses a threshold of five people, prompt targeted outreach to convert high-value prospects.
PLS doesn’t replace PLG; it enhances it. By combining the scalability of PLG with the precision of sales interventions, companies can achieve higher average contract values (ACVs) and long-term customer relationships.
Real-World Success Stories
The adaptability of PLG and PLS is evident in companies like Loom, which uses a freemium model to attract users and PLS to convert enterprise-level accounts. Similarly, Airtable’s collaborative features generate PQL signals, enabling sales teams to engage users at the right moment.
By blending self-service with strategic engagement, businesses can create a growth engine that caters to both individual users and enterprise clients. For a deeper dive into evaluating startup strategies, explore our startup evaluation checklist to uncover critical success factors.
PLG Performance Metrics
Understanding the right Product-Led Growth (PLG) metrics is essential for driving data-informed decisions and attracting investor interest. This section delves into a comprehensive array of PLG performance indicators, offering insights into product usage, customer behavior, and revenue growth. By focusing on these metrics, businesses can refine their strategies and demonstrate measurable success to stakeholders.
Key PLG Metrics to Track
1. Time to Value (TTV)
Time to Value measures how quickly users experience the core benefits of your product. A shorter TTV indicates that your product is intuitive and delivers immediate value, which can significantly improve user retention and satisfaction.
2. Product-Qualified Leads (PQLs)
PQLs are users who have engaged with your product to a degree that suggests they are ready for conversion. Tracking PQLs helps align product usage data with sales efforts, ensuring that resources are focused on high-potential leads.
3. Feature Adoption Rate
This metric evaluates how effectively users are adopting key features of your product. A high adoption rate signals that your product design aligns with user needs, while a low rate may indicate areas for improvement.
4. Expansion Revenue
Expansion revenue refers to the additional income generated from existing customers through upselling or cross-selling. It’s a critical indicator of customer satisfaction and the scalability of your product.
5. Average Revenue Per User (ARPU)
ARPU calculates the revenue generated per user over a specific period. This metric is vital for understanding the financial value of your user base and identifying opportunities for growth.
Advanced Metrics for Long-Term Growth
6. Customer Lifetime Value (CLV)
CLV estimates the total revenue a customer will generate during their relationship with your business. This metric is crucial for determining how much you can afford to spend on customer acquisition.
7. Net Revenue Churn
Net Revenue Churn measures the percentage of revenue lost due to customer downgrades or cancellations, offset by expansion revenue. A low churn rate indicates strong customer retention and satisfaction.
8. Net Revenue Retention (NRR)
NRR calculates the percentage of recurring revenue retained from existing customers, including upgrades and cross-sells. High NRR is a hallmark of successful PLG strategies.
9. Customer Satisfaction (CSAT)
CSAT scores provide direct feedback on how satisfied customers are with your product. High satisfaction levels often correlate with increased retention and advocacy.
Metrics That Drive Virality and Efficiency
10. Virality and Network Effects
Virality measures how effectively your product encourages users to invite others, while network effects assess the value added as more users join. Both are critical for organic growth.
11. Free-to-Paid Conversion Rate
This metric tracks the percentage of free users who upgrade to paid plans. A high conversion rate indicates that your product delivers clear value, encouraging users to invest.
12. Distribution and Customer Value
Distribution metrics evaluate how efficiently your product reaches its target audience, while customer value metrics focus on the benefits users derive from your product.
13. Efficiency Metrics
Efficiency metrics, such as Customer Acquisition Cost (CAC) and Customer Payback Period, help assess the cost-effectiveness of your growth strategies.
Recommendations for Data-Driven Decision Making
To ensure the accuracy and reliability of these metrics, businesses should integrate data-driven tools and external resources. For example, incorporating insights from startup due diligence can clarify how to verify claimed metrics and growth patterns, reducing risks and enhancing decision-making. You can explore more about this process in our detailed guide on startup due diligence.
By consolidating these PLG metrics into a unified framework, businesses can not only optimize their product strategies but also present compelling data to investors.
Assessing PLG Fit and Organizational Strategies
Determining whether a startup aligns with product-led growth (PLG) principles requires a close examination of its business model and organizational structure. PLG thrives on delivering exceptional product experiences, but this must be supported by operational capabilities that can scale effectively. Key factors such as product complexity, market demand, and team structure play a pivotal role in evaluating PLG readiness.
Evaluating Product Complexity and Market Demand
A product’s complexity directly impacts its suitability for PLG. Simpler, intuitive products that users can adopt without extensive onboarding are better suited for this strategy. However, even highly technical products can succeed with PLG if they address a clear market demand and offer self-service options for users. To deepen your understanding of how market signals and competition influence PLG readiness, it’s essential to assess product-market fit. This analysis ensures that the product not only meets user needs but also stands out in a competitive landscape.
Centralized vs. Decentralized PLG Teams
The structure of PLG teams evolves as companies grow. Early-stage startups often begin with centralized PLG teams, where a dedicated group focuses on driving product adoption and user engagement. As the company matures, these teams typically transition into decentralized, cross-functional squads. This shift allows for greater collaboration across departments, ensuring that PLG strategies are integrated into every aspect of the business. For example, a centralized team might initially handle user onboarding, but as PLG capabilities expand, decentralized squads can take ownership of specific user segments or product features.
This evolution highlights the importance of aligning organizational design with PLG goals. Startups aiming for scalable, global growth must ensure their team structures can adapt to increasing complexity while maintaining a user-centric approach.
Aligning Product Experience with Operational Capability
A successful PLG strategy hinges on the seamless integration of product experience and operational capability. While the product must deliver value independently, the organization must also be equipped to support user growth through scalable systems and processes. This alignment ensures that as the product gains traction, the company can sustain and amplify its growth momentum.
For investors, assessing this alignment provides critical insights into a startup’s potential for long-term success. By evaluating the interplay between product design, market demand, and organizational structure, it becomes easier to identify businesses that are primed to thrive under a PLG model.
Conclusion
Evaluating startup growth potential requires a blend of strategic insight and data-driven decision-making. By focusing on PLG metrics and ensuring organizational fit, investors can identify opportunities that align with their goals. These strategies not only streamline the selection process but also enhance the likelihood of long-term success.
Harnessing the power of data enables investors to make informed choices, minimizing risks and maximizing returns. Whether it's assessing product-market fit or analyzing user engagement, actionable metrics are key to unlocking growth opportunities.
If you're ready to connect with startups that match your investment criteria, explore our investor matchmaking solutions. At Qubit Capital, we specialize in bridging the gap between investors and promising startups, ensuring a seamless and rewarding collaboration.
Key takeaways
- Investors can leverage PLG metrics to accurately gauge startup growth potential.
- The integration of self-service product models with targeted sales drives scalable revenue.
- Metrics such as Time to Value, Net Revenue Retention, and Expansion Revenue are critical indicators.
- Organizational structure and market fit play a pivotal role in the success of PLG strategies.
- Qubit Capital services empower investors to identify and connect with high-potential startups.
Frequently asked Questions
What are the key metrics for product-led growth?
This post covers metrics such as Time to Value, Product-Qualified Leads, Net Revenue Retention, and more – all critical to assessing a startup’s potential.


