


Table of Contents
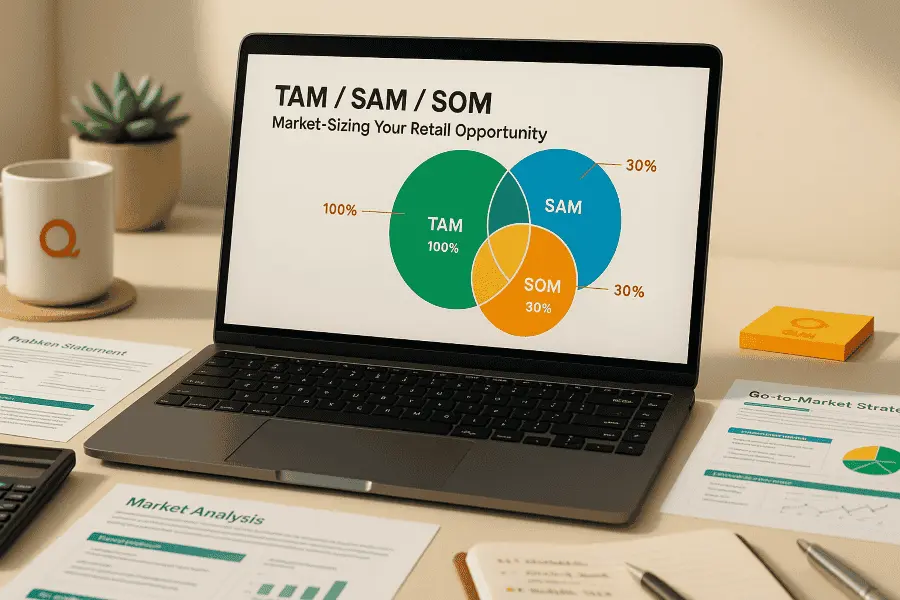
Defining your Total Addressable Market (TAM), Serviceable Available Market (SAM), and Serviceable Obtainable Market (SOM) is essential for identifying opportunities and setting realistic goals.
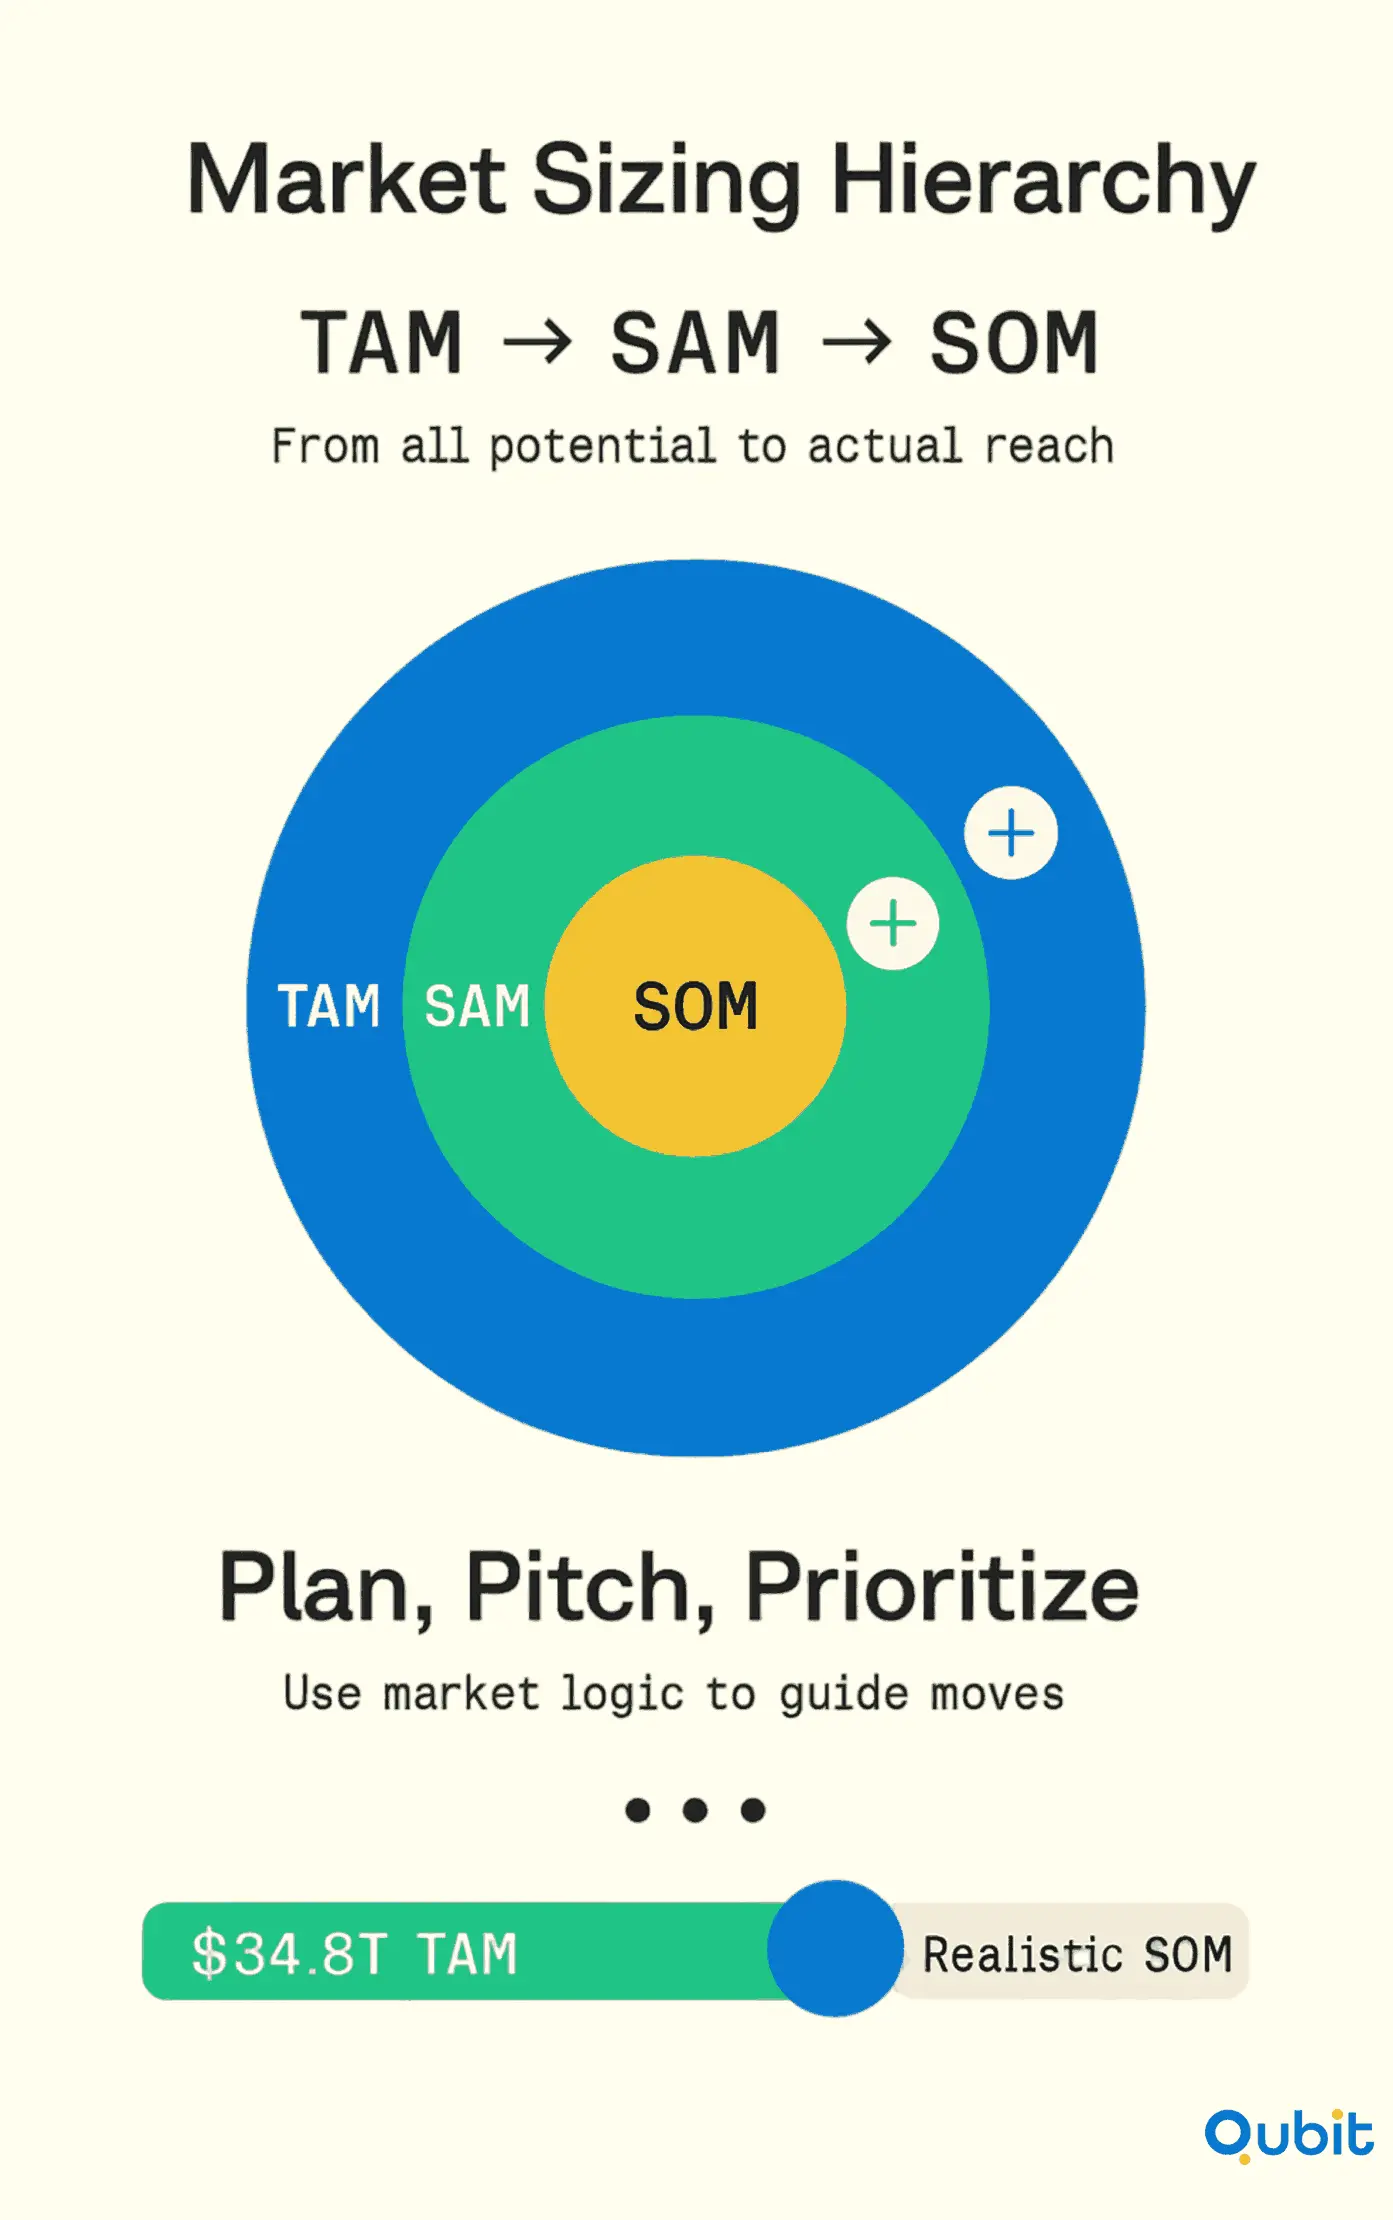
In 2025, global retail market value is projected to reach $34.8 trillion. This establishes TAM as a critical benchmark for retail founders seeking scale. Quantifying market opportunity supports clearer fundraising strategies and strategic planning.
These metrics not only help you gauge the scale of your market but also provide actionable insights for strategic decision-making. By aligning your TAM/SAM/SOM framework with investor expectations, you can enhance your pitch and secure the resources needed to thrive in the competitive retail landscape.
Let's dive in!
Market Sizing Hierarchy: TAM, SAM, SOM
Why Market Sizing Kills 42% of Startups (And How to Avoid It)
According to CB Insights' analysis of over 100 failed startups, 42% shut down because they built products with no market need. For retail founders, this often means:
- Overestimating total market size (TAM)
- Targeting segments you can't actually reach (SAM)
- Projecting unrealistic market share (SOM)
The cost? 75% of venture-backed companies never return cash to investors, and in 30-40% of cases, investors lose their entire initial investment.
The solution starts with honest, data-driven market sizing.
Understanding TAM, SAM, SOM: Your Market Sizing Hierarchy
Think of these metrics as a funnel that narrows from total opportunity to what you can realistically capture:
Total Addressable Market (TAM)
Definition: The total revenue opportunity if you captured 100% of every potential customer in your entire market category.
Example: If you're launching a sustainable fashion brand, your TAM includes all global apparel spending, not just eco-conscious consumers.
Serviceable Available Market (SAM)
Definition: The segment of TAM you can realistically serve based on your business model, geography, and capabilities.
How to Calculate: Filter TAM by:
- Geographic constraints (which countries/regions you operate in)
- Product category fit (which segments match your offering)
- Distribution channel access (online, brick-and-mortar, or both)
Example: Your sustainable fashion brand might focus on North American women's apparel sold through e-commerce, dramatically shrinking from the global TAM.
Serviceable Obtainable Market (SOM)
Definition: The portion of SAM you can realistically capture in the next 3-5 years, accounting for competition and operational constraints.
How to Calculate: Apply realistic market share assumptions based on:
- Competitor analysis
- Customer acquisition costs
- Unit economics and conversion rates
Example: In a crowded sustainable fashion market, you might target 0.5-2% of your SAM as an achievable initial SOM.
Two Proven Methods for Calculating Your Market Size
Calculating market size isn't one-size-fits-all. Your stage, available data, and business model determine which approach works best. Most sophisticated founders use both methods and compare the results to validate their assumptions.
Top-Down Approach: Starting with Industry Data
The top-down method begins with macro-level data from industry reports or government statistics, then applies filters to narrow down to your opportunity. This approach works particularly well for early-stage startups that lack customer data but need to demonstrate market scale to investors.
Here's how it works in practice. Imagine you're launching a clean beauty e-commerce platform. Start with the global beauty and personal care market, valued at $511 billion in 2024. Apply your first filter: you're focused on the US market, which represents roughly 20% of global spending. You're now at $102 billion. Apply your second filter: you're specifically targeting the clean beauty segment, which represents 15% of the US beauty market. Your SAM is now $15.3 billion. Finally, estimate realistic market share for year three—let's say 0.5% based on competitive analysis and growth projections. Your SOM becomes $76.5 million.
The strength of top-down analysis lies in its credibility. When you cite data from Euromonitor International, IBISWorld, or Statista, investors recognize authoritative sources. The weakness is that it can feel abstract, you're working with industry aggregates rather than customer-level insights.
Top-down works best for category validation, investor presentations, and early-stage planning when you don't yet have granular customer data. It answers the question: "Is this market big enough to pursue?"
Bottom-Up Approach: Building from Customer Economics
The bottom-up method builds estimates from individual data points—your actual or projected customer acquisition, conversion rates, and transaction values. This approach feels more concrete because it's grounded in customer behavior rather than industry reports.
Consider a startup selling sustainable kids' apparel to urban millennial parents. You'd start by defining your ideal customer profile, then calculate how many such customers exist. Research shows there are approximately 22 million US millennial households with children. Of these, roughly 40% live in major urban areas (8.8 million households). Among urban millennials, studies indicate about 40% actively seek sustainable products for their children (3.5 million households).
Now apply realistic conversion assumptions. In year one, you might penetrate 0.1% of this market, acquiring 3,500 customers. If your average order value is $85 and customers purchase four times per year, your SOM becomes $1.19 million (3,500 customers × $85 × 4 purchases).
The bottom-up approach shines when you have traction, customer data, or clear unit economics. It forces you to think through customer acquisition realistically rather than assuming percentage points of massive markets. Investors particularly value bottom-up models because they reveal whether you understand your customer acquisition engine.
Use bottom-up analysis for detailed financial modeling, operational planning, and any conversation about how you'll actually acquire customers. It answers the question: "Can you really get to these revenue numbers?"
The Value Theory Approach: For Disruptive Models
Sometimes neither top-down nor bottom-up fully captures your opportunity, especially when you're creating a new category or disrupting existing behavior. In these cases, value theory asks: "What value are we creating or what costs are we eliminating?"
Stitch Fix demonstrated this brilliantly in their S-1 filing. They calculated TAM by estimating the time customers saved on shopping (approximately 5 hours per month) and assigning economic value to that time ($25 per hour). This created $125 in monthly value per customer.
This approach works when traditional market sizing misses your actual innovation. Stitch Fix wasn't just competing with other styling services, they were competing with the entire inefficient process of shopping for clothes. Value theory captured that broader opportunity.
Retail-Specific Market Sizing Considerations
Generic market sizing frameworks miss critical nuances in retail. Here are three factors that can make or break your calculations.
1. The Omnichannel Reality: Don't Separate Online and Offline
One of the biggest mistakes retail founders make is treating online and offline as separate markets. The reality is far more complex. A Harvard Business Review study of 46,000 shoppers found that 73% use multiple channels during their shopping journey, instead of sticking to just one
What does this mean for your market sizing? Don't calculate separate TAMs for "online" and "offline." Instead, calculate total addressable customers across all channels and model how they'll interact with your brand touchpoints. A customer might discover you on Instagram, research on your website, visit your pop-up store to touch the product, and finally purchase through your mobile app. That's one customer journey, not four separate market segments.
This is especially critical if you're pitching a digitally-native vertical brand (DNVB) with plans to expand into physical retail. Investors want to see that you understand the unit economics across channels and can model how omnichannel behavior impacts lifetime value and acquisition costs.
2. Geographic Nuances: Population Doesn't Equal Purchasing Power
Not all geographies are created equal, and treating them as such inflates your market size beyond credibility. Market density and spending power vary dramatically across regions.
Data from the US Bureau of Labor Statistics shows that households in the New York metro area spend more overall than the US average, especially on categories like housing, food away from home, personal services and entertainment. For a premium home-goods brand, assuming that a rural household in the Midwest will spend like an affluent Manhattan apartment is a great way to overstate your SAM by several multiples, because income, housing size and discretionary budgets are all very different.
The fix is straightforward but requires more detailed modeling. Weight your SAM calculations by population density and spending power, not just raw population numbers. If your product targets affluent urban consumers, focus your calculations on the top 50 metro areas where your ideal customer actually lives.
This reduces your SAM on paper but dramatically increases your credibility with investors who've seen too many founders claim every American household is their target market.
3. Category Maturity: Growth Rates Matter as Much as Market Size
Research from Bain and Kantar on fast-moving consumer goods (FMCG) shows a classic “two-speed” pattern: offline FMCG sales in China grew by about 2–3%, while online FMCG sales grew more than 30% in the same period.
BCG and the World Retail Congress, meanwhile, find that retail “innovation leaders” invest more than four times as much of their revenue in innovation as laggards (13% vs 3%) and earn more than double the ROI (21% vs 9%).
This impacts your multi-year projections significantly. If you're entering a mature category, investors expect you to steal share from incumbents, a difficult, expensive proposition. If you're in an emerging category, you benefit from tailwinds but face questions about when the growth will slow and who'll dominate when it does.
Apply realistic growth rates to your TAM and SAM projections based on category lifecycle stage. Show you understand whether you're riding a wave or swimming against the current. This context makes your SOM targets far more defensible because investors can see you've modeled the market dynamics that will help or hinder your growth.
Tools & Resources for Retail Market Sizing
Use the right data and tools to size your market. See below for practical platforms.
- Industry Reports for Top-Down Estimates
- Subscribe to IBISWorld, Euromonitor, or Statista for clear snapshots of retail revenue trends, growth rates, and segment breakdowns.
- Use their big-picture figures to validate your Total Addressable Market (TAM) before you drill into specifics.
- Competitive Intelligence for Bottom-Up Detail
- Plug your competitors’ websites into SimilarWeb or Alexa to see traffic sources, visitor demographics, and engagement metrics.
- Export those charts to model your Serviceable Available Market (SAM) more accurately.
- Public Filings for Real-World Benchmarks
- Download 10-K or annual reports of public retail peers to capture KPIs like same-store sales, inventory turns, and margin profiles.
- Map those metrics onto your Serviceable Obtainable Market (SOM) scenarios for a reality check.
- Generative AI for Speed & Scale
- Feed raw survey results or CSV data into tools like ChatGPT or Claude to automatically segment audiences, forecast adoption curves, and stress-test different pricing and regional roll-outs.
Avoiding Inflated Market Sizing Risks
When leveraging market sizing tools, founders should avoid inflating projections beyond realistic bounds. Conservative, data-backed estimates build trust with investors and stakeholders. Overstated market numbers can undermine credibility and complicate future fundraising efforts. Prioritizing accuracy and transparency ensures that market sizing supports sustainable growth strategies.
How to Market to Your Retail Startup TAM, SAM & SOM
Turning those market numbers into revenue means tailoring your tactics at each layer:
TAM (Awareness)
- Launch broad-reach campaigns: Google Display Network, Facebook/Instagram ads, and guest articles in retail-focused publications.
- Lead with “omnichannel shopping experience” and “retail tech innovations” messaging to attract interest from all potential buyers.
For location-focused awareness, Texas grocery store visits rose 3.2% in early 2025. Tailor campaigns to shifting regional consumer habits for maximum TAM reach.
SAM (Engagement)
- Switch to precision tools: email drips segmented by customer persona, dynamic retargeting on social platforms, and personalized landing pages.
- Use simple AI personalization (e.g., product recommendations based on browsing behavior) to speak directly to each segment’s must-have features.
SOM (Conversion)
- Deploy sales-enablement assets: one-click demos, webinar invites, and limited-time discount codes.
- Retarget high-intent visitors with SMS alerts or LinkedIn InMail, and A/B test your calls-to-action (“Shop Now” vs. “Get a Free Trial”) to drive final purchases.
By following these tips, you’ll move smoothly from broad market visibility to targeted growth, and, ultimately, to closed deals.
Conclusion
Clear strategies and actionable insights are essential for effective market sizing. Throughout this blog, we’ve explored key approaches that emphasize the importance of storytelling and data-driven analysis. A well-structured narrative not only simplifies complex market data but also strengthens the impact of your pitch.
By focusing on clarity and precision, businesses can make informed decisions that align with their goals. Whether you’re refining your market sizing methods or preparing to present your findings, the ability to transform data into compelling narratives is invaluable.
If you’re looking to turn TAM/SAM/SOM into investor conviction, at Qubit we understand category definition, demand signals, translate your insights into a raise-ready story with our retail fundraising assistance and book a fast sizing review.
Key Takeaways
- Understand the hierarchical value of TAM, SAM, and SOM in market sizing.
- Utilize both top-down and bottom-up approaches for more accurate calculations.
- Real-world examples like Walmart illustrate practical SOM application.
- Incorporate tools like IBISWorld and SimilarWeb for dynamic market insights.
- Effective market sizing is crucial for strategic retail decision-making.
Frequently asked Questions
How do you calculate TAM, SAM, and SOM for a retail startup?
Calculate TAM with industry data, SAM by focusing on segments you can target, and SOM by estimating your realistic market share in those segments.