


Table of Contents
Knowing you are doing outreach is not the same as knowing it is working. If you cannot measure it, you end up repeating the same messages, chasing the wrong leads, and calling it “momentum” when it is actually noise.
Whether you are reaching out to investors, clients, or partners, tracking the right metrics keeps your strategy grounded. It shows what is getting replies, what is moving conversations forward, and where your pipeline is leaking.
This blog breaks down the outreach metrics that matter and the tools and dashboards that make them visible. You will learn which KPIs to track, how to build a simple dashboard that tells the truth, and how to use the data to improve results week after week. Let’s jump in.
Startup Metrics Overview for Tracking Outreach Performance
Track outreach performance by measuring key metrics, such as open rates and conversions, using dashboards for actionable insights.
Quantifying business performance is essential for startups aiming to scale effectively. Recent trends underscore the urgency of precise metric tracking. In the past year, 84% of sales reps missed quota. This gap highlights the impact of incomplete performance monitoring. For startups, improving visibility into these metrics helps avoid costly setbacks and enables more effective growth trajectories.
Key startup metrics validate growth claims. They also build trust among stakeholders.

- Identify metrics
- Select dashboard tool
- Set benchmarks
- Track regularly
A strong connection exists between tracking growth and financial metrics and achieving faster scaling. For instance, startups that monitor their performance closely often demonstrate notable benchmarks, such as an 18% compound average growth rate.
This statistic highlights the momentum that well-tracked startups can achieve. Additionally, improvements in net revenue retention, such as moving from 102% to 110%, underscore the importance of focusing on retention-driven revenue calculations. These benchmarks not only reflect growth but also signal operational efficiency and customer satisfaction.
Your exploration of outreach performance metrics finds a broader context in how to do startup outreach for investors, which offers a comprehensive overview of investor engagement strategies. By focusing on actionable data, you can refine your approach and maximize impact.
Financial Metrics
Why financial metrics matter: Financial metrics help founders make better decisions and help investors quickly judge stability, efficiency, and readiness to scale. They also add credibility to outreach because strong numbers reduce perceived risk.
- Core metrics to track: Track revenue, gross profit, margins, burn rate, and runway to understand performance and constraints. Together, they show how efficiently the company operates and how long it can keep moving without new capital.
- Revenue and gross profit: Revenue shows your ability to generate income. Gross profit shows how much you keep after direct costs, which is a clearer signal of whether the business can become profitable at scale.
- Burn rate and runway: Burn rate is how quickly you spend cash each month. Runway estimates how long your current cash will last. This pair is the simplest way to communicate sustainability and urgency.
- LTV/CAC ratio: LTV/CAC compares the value a customer generates to the cost of acquiring them. A healthy LTV/CAC ratio, typically between 3:1 and 5:1, signals sustainable business economics and improves investor confidence.
Your analysis of key metrics is enriched by approaches that explain how to automate investor outreach, highlighting ways to streamline email communications. Automating outreach can reduce costs tied to Customer Acquisition Costs and improve financial outcomes. By mastering these financial metrics, startups can ensure they are on the path to sustainable growth.
Customer Metrics
Understanding customer metrics is essential for driving marketing ROI and fostering long-term relationships. Metrics such as customer acquisition, retention, and satisfaction provide a clear picture of how well your business is performing in attracting and keeping clients. These indicators not only measure success but also help refine strategies to ensure sustainable growth.
The Role of Customer Retention Metrics
Customer retention metrics are particularly valuable for evaluating the effectiveness of your marketing efforts. By analyzing repeat purchase rates, churn rates, and customer lifetime value (CLV), businesses can identify areas for improvement and create strategies to enhance customer loyalty. Retention-focused initiatives often yield higher ROI compared to acquisition efforts, as retaining existing customers is generally more cost-effective than acquiring new ones.
Retention strategies deliver measurable business value. In 2025, 74% of revenue comes from existing customers. This finding emerges from industry leadership surveys on customer-driven growth. Prioritizing current client relationships increases revenue stability and customer lifetime value.
Refining Strategies Through Sales Cycle Analysis
Sales cycle analysis is another critical component of understanding customer behavior. By tracking the time it takes to convert a lead into a customer, businesses can pinpoint inefficiencies and optimize their sales processes. Additionally, monitoring customer interest and engagement throughout the sales cycle provides valuable insights for refining targeting and positioning.
Feedback loops also play a pivotal role in improving customer satisfaction. Regularly collecting and analyzing customer feedback allows businesses to address pain points and adapt their offerings to meet evolving needs. Your focus on tracking success is further informed by concepts related to AI-driven prospecting platforms, a topic that delves into advanced methods for enhancing startup outreach.
By integrating these metrics and tools, businesses can create a data-driven approach to building stronger customer relationships and achieving long-term success.
Product Metrics
Understanding how users interact with your product is essential for startups aiming to achieve sustainable growth. Key product metrics for startups, such as adoption, activation rates, and usage frequency, offer a window into user engagement and the product's alignment with market needs.
- Core product metrics to track: Track adoption, activation, and usage frequency to understand how users move from first touch to consistent engagement. Together, they highlight growth potential and areas of friction.
- Adoption rate: Adoption shows how effectively you attract and onboard new users. If adoption is strong but retention is weak, you may have good marketing but a product value gap.
- Activation rate: Activation measures how many users reach a meaningful milestone, like completing onboarding or using a core feature. This is where you find friction, because low activation usually means users do not reach value fast enough.
- Usage frequency: Usage frequency shows how often users return and engage. It helps you judge stickiness and long-term value, especially when tracked by user segment and use case.
Data-driven decisions based on these metrics can significantly enhance user experiences. For instance, analyzing activation rates might uncover onboarding inefficiencies, prompting targeted improvements that boost conversions.
Similarly, tracking usage frequency can help identify features that drive engagement, enabling teams to prioritize their development. These refinements not only improve activation rates but also reduce churn by addressing user pain points proactively.
For startups looking to optimize their outreach and product strategies, a closer look at investor data enrichment services can complement product metrics. Rich lead data helps prioritize product feature rollouts for high-value users, ensuring resources are allocated effectively.
Growth Metrics
Understanding growth metrics for startups is essential to evaluate long-term progress, scalability, and tracking outreach performance.
Key Growth Indicators
Year-over-Year Growth
YoY growth measures how revenue, customer base, or other critical metrics evolve annually. This metric is invaluable for identifying trends and assessing whether strategies are yielding consistent results over time.Monthly Recurring Revenue (MRR)
MRR is a cornerstone metric for subscription-based businesses. It tracks predictable revenue streams, enabling startups to plan budgets and allocate resources effectively. High-performing startups that monitor MRR alongside churn rates often achieve faster scalability.Customer Acquisition and Retention Rates
Growth isn’t just about acquiring new customers; retaining them is equally vital. Retention rates reflect customer satisfaction and loyalty, while acquisition rates indicate the effectiveness of marketing and sales efforts. Together, these metrics provide a balanced view of growth.Viral Coefficient
The viral coefficient measures how effectively existing customers bring in new ones. A coefficient above 1 signals exponential growth potential, as each customer contributes to expanding the user base.North Star Metric
A North Star Metric is the most important measure of your startup's long-term success. Choose a North Star Metric, a core measure that captures mission-driven success.
Growth planning requires awareness of changing conditions. Over the last year, startups experienced a 24% increase in sales cycle length, rising from around 60 to 75 days. Recognizing such shifts helps founders adapt their go-to-market strategies and forecast growth more accurately.
By focusing on these metrics, startups can build a robust framework for measuring success and scaling effectively. Your discussion on performance tracking is complemented by insights from the best tools for startup outreach, providing a look into the technological aspects that support effective outreach.
Marketing Metrics
Understanding and applying marketing metrics for startups is essential for maximizing advertising efficiency and building brand recognition. Metrics like customer acquisition cost (CAC), funnel conversion rates, and campaign ROI provide actionable insights that help refine strategies and allocate budgets effectively.
1. Customer Acquisition Cost (CAC)
CAC measures the total cost of acquiring a new customer, including marketing expenses and sales efforts. A lower CAC indicates efficient spending, while a high CAC may signal the need to reassess targeting or campaign strategies. For startups, maintaining a sustainable CAC is critical to scaling operations without overextending resources.
2. Funnel Conversion Rates
Tracking conversion rates at each stage of the marketing funnel reveals where potential customers drop off. By identifying these bottlenecks, startups can optimize their messaging, improve user experience, and enhance lead nurturing efforts. A well-optimized funnel not only increases conversions but also reduces overall acquisition costs.
3. Campaign ROI
Campaign ROI evaluates the profitability of marketing initiatives by comparing the revenue generated to the costs incurred. This metric is invaluable for determining which campaigns deliver the best returns and which require adjustments. Startups can use this data to prioritize high-performing channels and eliminate underperforming ones.
By consistently monitoring these metrics, startups can make data-driven decisions that enhance their marketing impact. Whether it’s reducing CAC, improving funnel efficiency, or maximizing ROI, these insights are the foundation for sustainable growth.
Common Challenges in Tracking Startup Metrics
Tracking metrics sounds simple until you try to pull data from five different tools, realize everyone defines the same metric differently, and discover your “dashboard” is basically a weekly guessing game. These problems are common, and they can make good teams look inconsistent when the real issue is messy tracking.
- Data fragmentation: When data lives across multiple tools, it becomes difficult to consolidate and compare. You spend time stitching numbers together, and small errors stack up fast.
- Inconsistent measurement methods: If teams use different definitions for the same metric, the data becomes unreliable. One person’s “active user” might be another person’s “logged in once,” and now your trendline is fiction.
- Limited resources: Startups often lack budget, tooling, or skilled analytics support. That makes it harder to set up clean pipelines, maintain dashboards, or run regular checks.
If data sources are unavailable track manually in the short term and centralize as soon as possible. A simple spreadsheet with consistent definitions beats scattered tools with messy logic.
How to fix the problem
Consolidate tools where you can, so core data flows into one place. Set standard definitions for your key metrics and document them, then run regular audits to catch drift. If resources are tight, focus on the few metrics that actually drive decisions, and choose tools that can scale with you instead of forcing a full rebuild later.
When you solve these basics, tracking stops being busywork and starts becoming a reliable system for making better decisions.
Selecting and Tracking Key Startup Metrics
Choosing the right metrics for your startup is a critical step in building a sustainable growth strategy. A well-structured startup metrics roadmap ensures that your metrics align with your business objectives, reflect your current performance, and resonate with the audience you aim to serve. This alignment not only helps you measure progress effectively but also ensures that your team and stakeholders remain focused on what truly matters.
1. Align Metrics with Business Goals
Start by identifying the core objectives of your startup. Are you focused on customer acquisition, revenue growth, or product adoption? Your metrics should directly reflect these goals. For example, a SaaS startup prioritizing user retention might track churn rate and customer lifetime value (CLV), while an e-commerce business might focus on average order value (AOV) and conversion rates.
2. Assess Current Performance
Understanding where your startup stands today is essential for setting realistic benchmarks. Analyze your existing data to identify trends, gaps, and opportunities. This process not only highlights areas for improvement but also ensures that your chosen metrics are actionable and relevant to your current stage of growth.
3. Tailor Metrics to Your Audience
Metrics should be tailored to the needs of your audience, whether they are investors, internal teams, or customers. For instance, investors may prioritize financial metrics like monthly recurring revenue (MRR), while your product team might focus on user engagement metrics. Customizing your metrics ensures clarity and relevance for all stakeholders.
4. Iterate as Goals Evolve
No single set of metrics will serve your startup forever. As your business grows and objectives shift, your metrics should evolve accordingly. Regularly revisiting and refining your startup metrics roadmap ensures that your tracking efforts remain aligned with your long-term vision.
By selecting metrics that align with your goals, assessing your current performance, and tailoring them to your audience, you can create a dynamic system for tracking progress and driving growth.
Pre-Seed And Early-Stage Metrics: Proving Demand And Showing Growth Potential
At the pre-seed stage, your job is to prove demand exists. At the early stage, your job is to prove that demand can turn into repeatable growth. The metrics you track should reflect that shift, from interest signals to performance signals.
In pre-seed, focus on proof that people want the product before it is fully built. User signups and waitlist conversion rates are strong early indicators because they show intent, not just curiosity. Signup velocity can also validate whether your messaging and value proposition are landing. A growing waitlist suggests anticipation and trust, which is useful when you are still validating the problem.
Do not stop at raw counts. Engagement signals matter just as much because they show depth of interest. Look for behaviors like waitlist shares, questions, feedback, replies to emails, or repeat visits to your landing page. These actions suggest users are not only interested, but invested.
As you move into early stage, the focus expands to growth potential and sustainability. User acquisition trends help show whether you can attract customers consistently. Early revenue growth, such as steady month-over-month increases, signals monetization and financial viability. Engagement and retention metrics, like DAUs and repeat usage, show whether the product delivers ongoing value rather than a one-time spike.
Together, these metrics help you build a clean story: the market wants this, users engage with it, and growth is becoming repeatable. That narrative is what makes it easier to raise, hire, and scale.
Growth Stage Metrics: Scaling with Efficiency
Scaling operations effectively requires a sharp focus on metrics that indicate sustainable growth. At the growth stage, businesses must prioritize managing churn, building scalable revenue streams, and fostering strong user retention. These elements are not just indicators of success but are essential for long-term stability.
1. Churn Management: Retaining What You’ve Built
Customer churn is a silent growth killer. High churn rates can erode even the most promising revenue streams, making it critical to identify and address the root causes. Regularly analyzing customer feedback, improving onboarding experiences, and offering proactive support are proven strategies to reduce churn. A lower churn rate not only stabilizes revenue but also signals that your product or service is meeting user expectations.
2. Scalable Revenue: Growth Without Overextension
Sustainable scaling hinges on revenue models that can grow without proportionally increasing costs. Subscription-based pricing, tiered plans, and upselling opportunities are examples of scalable revenue strategies. By aligning revenue growth with operational efficiency, businesses can expand their market share without sacrificing profitability.
3. User Retention: The Foundation of Efficiency
Strong user retention is a hallmark of efficient scaling. Retained customers often have higher lifetime value and are more likely to advocate for your brand. To achieve this, focus on delivering consistent value, personalizing user experiences, and maintaining regular engagement through updates or loyalty programs.
By mastering these metrics, businesses can scale with confidence, ensuring that growth is both efficient and sustainable.
Late Stage Metrics: Preparing for Acquisition/IPO
When preparing for an acquisition or IPO, the financial metrics you present can make or break investor confidence. Among the most critical exit strategy metrics are EBITDA (Earnings Before Interest, Taxes, Depreciation, and Amortization), net margins, and consistent revenue growth. These indicators provide a clear snapshot of your company’s financial health and operational efficiency.
EBITDA serves as a key measure of profitability, stripping away non-operational expenses to focus on core earnings. Investors often rely on this metric to compare your business with others in the same industry. Similarly, net margins highlight how effectively your company converts revenue into profit, offering insights into cost management and pricing strategies.
Equally important is demonstrating consistent revenue growth. This metric reassures potential buyers or public market investors that your business has a sustainable trajectory. Fluctuations in revenue can raise red flags, signaling instability or market challenges.
To ensure readiness, businesses should also focus on presenting a clean financial history and addressing any irregularities. This not only builds trust but also strengthens your valuation.
Startup Metrics Glossary
Understanding startup metrics can feel overwhelming, especially with terms like ARPU, LTV, and churn rate frequently thrown around. This quick reference glossary simplifies these essential metrics, making them accessible for anyone aiming to decode startup performance.
ARPU (Average Revenue Per User): This metric calculates the revenue generated per user over a specific period. It’s a key indicator of how much value each customer brings to your business.
LTV (Customer Lifetime Value): LTV estimates the total revenue a business can expect from a single customer throughout their relationship. It’s crucial for assessing long-term profitability and determining how much you can afford to spend on customer acquisition.
Churn Rate: This measures the percentage of customers who stop using your product or service within a given timeframe. A high churn rate signals retention issues, while a low churn rate reflects customer satisfaction and loyalty.
These metrics, among others, are vital for startups to track growth, optimize strategies, and make data-driven decisions. By understanding these terms, you can better evaluate your business’s performance and identify areas for improvement.
Whether you’re a founder, investor, or team member, having a solid grasp of these metrics ensures you’re speaking the same language when discussing growth and success.
Outreach Team Metrics Overview for Tracking Outreach Performance
Measuring the effectiveness of outreach campaigns requires a clear understanding of key performance indicators. Outreach metrics, such as email open rates, response times, and conversion rates, provide valuable insights into how well campaigns are resonating with their target audiences. These metrics not only quantify success but also highlight areas for improvement, ensuring that outreach strategies remain dynamic and impactful.
Email open rates, for instance, reveal how compelling subject lines and initial messaging are in capturing attention. A high open rate often signals that the outreach is aligned with audience interests, while a low rate may indicate the need for adjustments in timing or personalization. Response times, on the other hand, measure the efficiency of follow-ups and the team's ability to engage prospects promptly. Faster response times can significantly enhance the likelihood of meaningful interactions.
Conversion rates serve as a critical metric, showcasing the percentage of recipients who take desired actions, such as signing up for a program or scheduling a meeting. This metric directly reflects the overall success of an outreach campaign in achieving its goals. Additionally, tracking community program enrollments or event participation can provide a broader perspective on engagement levels.
By consistently analyzing these metrics, outreach teams can refine their strategies to maximize impact. Whether it’s tweaking email content or optimizing response workflows, data-driven decisions ensure campaigns remain effective and relevant.
Setting Qualification Criteria for Outreach Opportunities
Building on the importance of outreach metrics, teams must establish clear qualification criteria for Opportunities and leads. These standards help ensure that only meaningful prospects enter the pipeline, reducing wasted effort and improving measurement accuracy. By defining what constitutes a qualified Opportunity, outreach teams can focus resources on high-potential leads and track progress more effectively. This approach supports more reliable reporting and enables targeted improvements to outreach strategy.
Tracking Outreach Team Metrics
Real-time tracking of outreach metrics is vital for tracking outreach performance and can transform how teams optimize their strategies.
Dashboards serve as a powerful tool to visualize key performance indicators like open rates, response times, and final conversions. By presenting this data in an accessible format, teams can identify trends and make informed adjustments to improve outcomes.
For instance, monitoring open rates helps pinpoint the effectiveness of subject lines and email timing. A sudden dip in response times might indicate the need for better follow-up processes or more engaging content. Similarly, tracking final conversions provides clarity on which outreach methods are driving results and which need refinement.
Dashboards also enable teams to act quickly. If response times are lagging, managers can intervene immediately to address bottlenecks. Likewise, tracking outreach metrics in real time ensures that strategies remain agile, adapting to live data rather than relying on outdated reports.
By integrating these metrics into a centralized dashboard, outreach teams gain a comprehensive view of their performance. This empowers them to refine their approach, ensuring every interaction contributes to the overall success of their campaigns.
AI-Powered Outreach Metrics
Artificial intelligence is transforming how businesses approach outreach campaigns. By integrating AI in outreach analytics, organizations can achieve unprecedented precision in targeting, personalization, and performance tracking.
AI-driven tools analyze vast datasets to identify patterns and trends that human analysis might overlook. This capability allows businesses to segment their audience more effectively, ensuring that outreach efforts are directed at the right individuals. For example, AI can predict customer preferences based on historical data, enabling hyper-targeted messaging that resonates with specific demographics.
Personalization also reaches new heights with AI. By dynamically tailoring content to individual user behaviors and preferences, businesses can foster deeper connections with their audience. Whether it’s through personalized email campaigns or adaptive website experiences, AI ensures that every interaction feels relevant and engaging.
Performance tracking is another area where AI excels. Traditional metrics often provide a static snapshot of campaign success, but AI offers real-time insights that adapt as campaigns unfold. This dynamic feedback loop allows businesses to refine their strategies on the go, optimizing outcomes and maximizing ROI.
Recent investment trends reinforce the importance of these financial metrics. Bessemer illustrates sector commitment, having deployed over $1 billion in capital to AI-native startups since 2023. This large-scale funding highlights investor priorities, sustained revenue and efficiency, when evaluating high-growth, exit-ready companies.
Incorporating AI in outreach analytics not only enhances efficiency but also empowers businesses to make data-driven decisions with confidence. As AI continues to evolve, its role in outreach campaigns will only grow, offering even more innovative ways to connect with audiences.
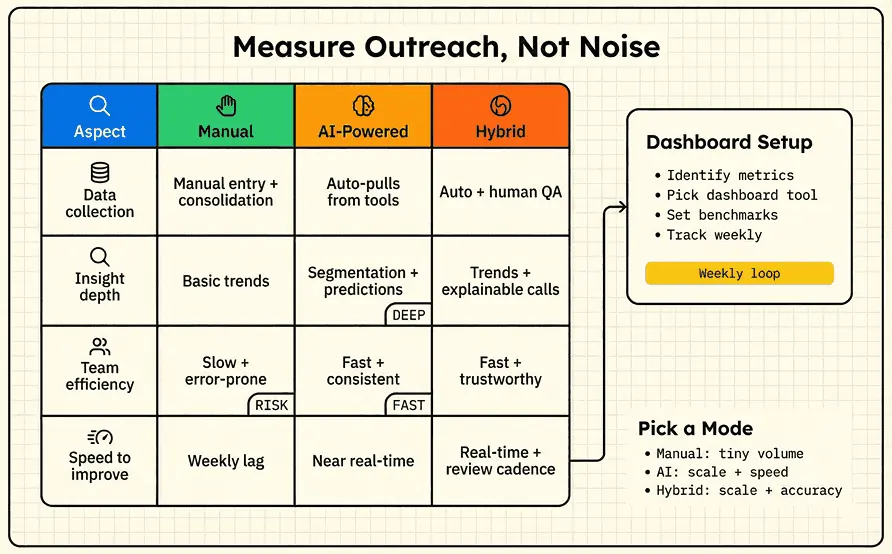
Manual vs. AI-Powered Outreach Metric Tracking
| Aspect | Manual tracking | AI powered tracking |
|---|---|---|
| Data collection | Requires manual entry and consolidation | Automates data gathering from multiple sources |
| Insight depth | Limited to basic trend analysis | Enables predictive analytics and segmentation |
| Team efficiency | Time consuming and error prone | Streamlines workflow and reduces errors |
Outreach Team Metrics Examples
Measuring outreach success requires tailored metrics that align with specific goals and contexts. Whether assessing patient conversion rates in healthcare or tracking youth entrepreneurship program outcomes, examples of outreach metrics provide clarity and direction.
1. Healthcare Outreach Metrics
In healthcare, outreach teams often focus on patient engagement and risk assessment. Metrics such as the percentage of high-risk patients identified through screenings or the number of follow-up appointments scheduled after outreach campaigns can highlight effectiveness. For example, tracking patient conversion rates—how many individuals transition from initial contact to receiving care, offers a clear indicator of outreach success.
2. Youth Entrepreneurship Metrics
Programs aimed at fostering youth entrepreneurship benefit from metrics that measure participation and skill development. Examples include the number of workshops conducted, the percentage of attendees who launch a business within six months, or the increase in entrepreneurial knowledge as assessed through pre- and post-program surveys. These metrics help organizations refine their approach and amplify their impact.
3. Community Impact Metrics
Community-focused outreach often prioritizes engagement and long-term benefits. Metrics such as the number of community members attending events, the percentage of participants reporting improved access to resources, or the growth in local partnerships can demonstrate the program’s reach and effectiveness.
Providing context-specific metrics ensures effective focus, whether identifying patient needs or empowering young entrepreneurs. Tailored metrics not only measure success but also guide future strategies for outreach teams.
Additional Outreach Metrics
A deeper understanding of outreach effectiveness often requires looking beyond basic engagement statistics. Supplementary metrics such as brand sentiment scores, influencer reach, and net promoter scores (NPS) provide a more comprehensive view of how outreach strategies resonate with audiences.
1. Brand Sentiment Metrics
Brand sentiment metrics measure the emotional perception of your brand among your target audience. These scores are derived from analyzing customer feedback, social media mentions, and reviews. Positive sentiment indicates successful outreach efforts, while negative sentiment highlights areas for improvement. Tracking these metrics helps businesses align their messaging with audience expectations and refine their strategies for better results.
2. Influencer Reach
Collaborating with influencers can amplify outreach efforts, but understanding their reach is crucial. Influencer reach evaluates the size and engagement level of an influencer’s audience, ensuring that partnerships align with your brand goals. Metrics like follower demographics, engagement rates, and content performance provide insights into whether an influencer’s audience matches your target market.
3. Net Promoter Score (NPS)
NPS gauges customer loyalty and satisfaction by asking a simple question: “How likely are you to recommend our brand to others?” Responses are categorized into promoters, passives, and detractors. A high NPS indicates strong customer advocacy, which often correlates with effective outreach campaigns. Monitoring NPS over time helps businesses identify trends and adjust their strategies to foster stronger customer relationships.
Continuous Micro-Testing for Outreach Optimization
Beyond tracking advanced metrics, outreach teams should implement continuous micro-testing of their messaging. This process involves regularly experimenting with subject lines, calls to action, and content variations to identify what resonates best. Consistent optimization based on test results can significantly improve conversion rates and overall outreach effectiveness. Over time, these incremental adjustments help build a more responsive and successful outreach strategy.
Incorporating these metrics into your outreach analysis ensures a holistic approach, enabling businesses to make informed decisions that drive meaningful engagement and long-term success.
Outreach Planning Resources
Refining your outreach metric frameworks becomes significantly easier with the right tools and communities. Specialized platforms and professional networks offer invaluable insights, helping you align your strategies with industry best practices.
1. Specialized Platforms for Outreach Metrics
Platforms tailored to outreach analytics provide robust frameworks for tracking and improving your metrics. These tools often include features like customizable dashboards, real-time reporting, and predictive analytics. By utilizing these resources, you can identify gaps in your current approach and implement data-driven solutions.
2. Professional Communities for Shared Insights
Engaging with professional communities is another effective way to enhance your outreach strategies. These groups often host discussions, webinars, and case studies that highlight innovative practices. Participating in these forums allows you to exchange ideas, gain fresh perspectives, and refine your metrics based on proven methodologies.
3. Combining Resources for Maximum Impact
Integrating insights from both specialized platforms and professional communities can amplify your results. While platforms provide the technical tools, communities offer the human element, real-world experiences and advice that software alone cannot replicate.
Conclusion
The strategies outlined in this blog emphasize the importance of tracking outreach performance through measurable goals and actionable insights.
At Qubit Capital, we understand the value of data-driven decision-making. Our Investor Discovery and Mapping service is designed to empower startups with tailored insights that enhance outreach performance. Explore how we can help you uncover opportunities and build meaningful connections.
Integrating these strategies into your outreach plan not only boosts efficiency but also ensures long-term success. Take the next step toward smarter outreach by leveraging the tools and expertise available through our services.
Key takeaways
- Comprehensive tracking of startup and outreach metrics is essential for driving growth.
- Financial, customer, product, and growth metrics provide a holistic view of performance.
- Effective outreach measurement enables real-time strategy refinement.
- AI-driven analytics and dashboards enhance targeting and personalization.
- Aligning metrics to business goals supports informed, data-driven decision-making.
Frequently asked Questions
How do AI tools enhance outreach metrics tracking for startups?
AI tools help startups analyze outreach metrics by automating data analysis, improving targeting, and enabling real-time strategy adjustments.