


Table of Contents
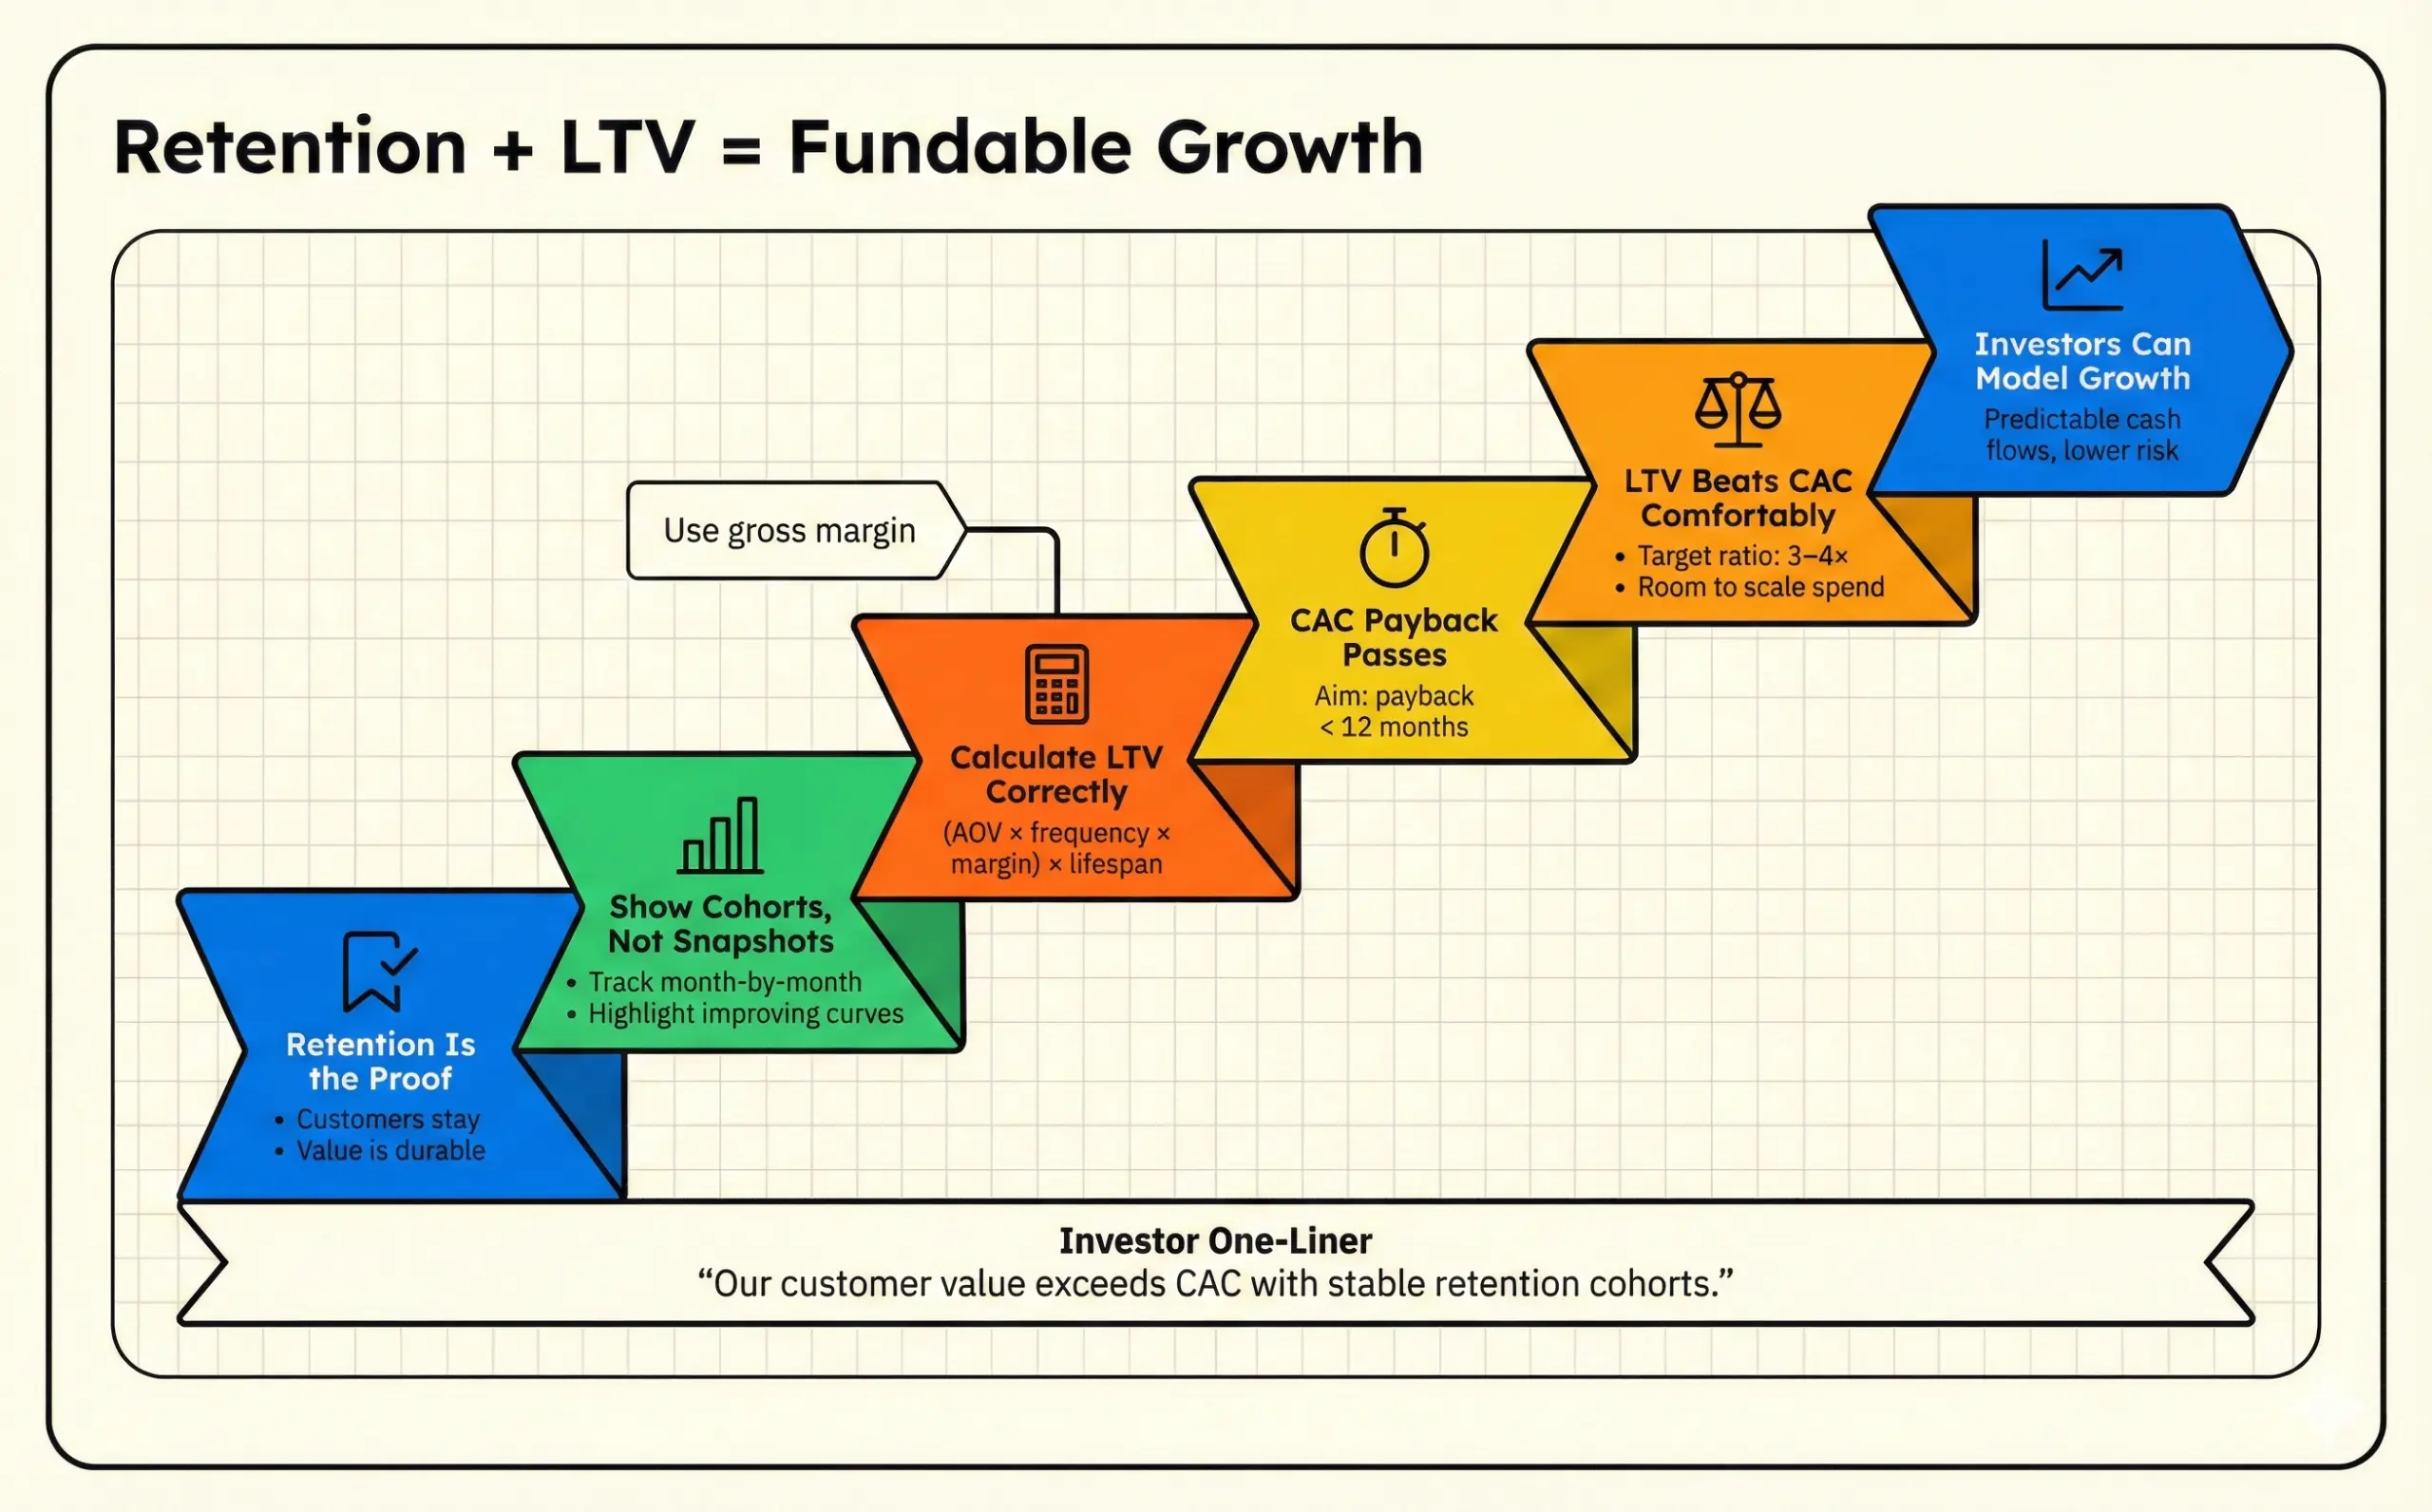
Sophisticated investors are no longer impressed by a single spike in sign-ups or revenue. They want proof your growth can last. That is why customer retention and lifetime value matter so much in fundraising. They show whether customers stick around, keep paying, and create durable value, instead of churning right after you spend to acquire them.
Retention is not a vanity metric. It is a profit lever. Bain & Company found that improving retention by just 5% can increase profits by 25% to 95%, because returning customers tend to buy more often, spend more over time, and cost less to serve than new ones.
Ahead, you will learn how to measure retention and LTV correctly, present them with cohort and segmentation views, and show investors a simple truth: customer value comfortably exceeds CAC.
Why Proving Retention and LTV Matters to Investors
Investors view retention and LTV as predictive indicators of business sustainability rather than just operational metrics. Unlike vanity metrics that can be artificially inflated through marketing spend, retention patterns and customer lifetime value reveal fundamental product-market fit (PMF), meaning your solution closely matches customer needs, and business model viability. Investors translate strong retention directly into higher valuation multiples. A SaaS business with 1% monthly churn often trades at 8x to 12x ARR. The same company at 5% churn typically lands at 3x to 5x. That gap can swing pre-money valuation by tens of millions at Series A or B.
From an investor’s perspective, these metrics answer critical questions:
- Does your product solve a real problem that customers value long-term?
- Can your business generate sustainable revenue growth without constantly increasing acquisition costs?
- Will customer economics improve as the business scales?
- What is the realistic growth trajectory based on customer behavior patterns?
Strong retention and LTV also shape how investors think about exit strategies in consumer investing, since predictable revenue makes acquisition and IPO outcomes more attractive.
Startups like yours already closed their rounds with us.
Founders across every stage and industry. Here's what it took.
- Raised $7.6M for Swiipr Technologies
- Raised $0.5M for Ap Tack
- Raised €0.5M for Ivent Pro

What Drives Investor Interest?
Investors care about retention and LTV because these two metrics determine how efficiently your company can grow, and how predictable future cash flows will be. Both factors directly affect returns.
First, strong retention increases the value of every customer you acquire. When customers stick around, their lifetime value rises. Higher LTV gives you more room to spend on acquisition, which means you can scale faster through paid channels without destroying margins. Run the math on a $500 LTV product. If monthly churn drops from 5% to 2%, lifespan jumps from 20 months to 50 months. Your LTV ceiling moves from $500 to $1,250 with no other change. That extra headroom funds a 2.5x larger CAC budget at the same payback period.
That is where CAC payback becomes a quick reality check. For most consumer startups, CAC payback should be less than 12 months. This means if £100 is spent to acquire a customer, they should generate at least £100 in revenue within a year. Hitting this threshold signals capital-efficient growth and reduces the risk that scaling will require constant fundraising.
Retention also improves predictability. Revenue from returning customers is more stable than revenue driven by one-time purchases. Predictable revenue lowers business risk, makes valuations easier to defend, and strengthens the story around exit outcomes. Public SaaS comps reward this directly. Companies with 90% gross retention often trade at 2x to 3x the ARR multiple of 70% retention peers. On a $10M ARR raise, that gap can swing your pre-money by $30M or more. Lower business risk also means less dilution per dollar raised at every stage.
Here is what the math looks like in practice. If your average customer generates $1,000 in lifetime value and costs $300 to acquire, you have a healthy 3.3:1 LTV:CAC ratio. That ratio signals sustainable unit economics, meaning the revenues and costs tied to a single customer. With numbers like these, investors can model growth with more confidence, because each marketing dollar has a clearer, repeatable payoff.
Proving retention and LTV to secure funding is essential, as these metrics directly impact investment returns through multiple mechanisms.
For a broader view of what drives funding decisions in this space, see our guide to consumer and D2C startups.
How to Calculate and Measure LTV?
Customer lifetime value is the total revenue you can expect from one customer over the full length of their relationship with your business. It helps you understand how much a customer is worth, so you can decide how much you can afford to spend to acquire and retain them. LTV defines your maximum payback budget per customer. If LTV is $1,000 and target payback is 12 months, your CAC ceiling sits around $300 to $400. Going higher means you fund growth from the next round, not from operations. Most early-stage investors want LTV at least 3x CAC before underwriting the round.
Core LTV Calculation Methods
Start with the simplest version. It uses three building blocks:
LTV = Average Purchase Value × Purchase Frequency × Customer Lifespan
If you want a more accurate view, include gross margin so you are measuring value after direct costs, not just top-line revenue:
Advanced LTV = (Average Order Value × Purchase Frequency × Gross Margin) × Customer Lifespan
Practical LTV Calculation Example
Here is a simple SaaS example to show how the math works in real life.
Inputs:
- Average monthly subscription: $99
- Gross margin: 80%
- Monthly churn rate: 4%
- Average customer lifespan: 24 months
Step 1: Calculate monthly gross profit per customer
Monthly value: $99 × 0.80 = $79.20
Step 2: Estimate customer lifespan from churn
Customer lifespan: 1 ÷ 0.04 = 25 months
Step 3: Calculate total LTV
Total LTV: $79.20 × 25 = $1,980
Why this matters for investors
An LTV figure translates customer behavior into a predictable value per customer. That clarity makes CAC limits, payback expectations, and scaling efficiency far easier to judge.
Segmented LTV Analysis
Sophisticated startups segment LTV calculations across multiple dimensions to provide investors with deeper insights:
A SaaS subscription business reported an LTV of $200 with customers subscribing for 8 months at $25 per month. Their CAC was $100, leading to a four-month payback period. This segmentation by acquisition channel and subscription tier provides investors with targeted profitability insights.
Investors often compare these segment-level LTV patterns when evaluating D2C and marketplace ventures across their portfolio.
Measuring and Presenting Retention Metrics
Customer retention rate is the base layer for LTV and a key trust signal for investors. It shows whether customers stay after you remove the effect of new sign-ups.
Use the standard formula:
Retention Rate = ((Customers at End – New Customers) ÷ Customers at Start) × 100
Monthly Cohort Example
Inputs:
- January 1 customers: 1,000
- January 31 customers: 950
- New customers acquired in January: 200
Calculation:
- Retained customers = 950 – 200 = 750
- January retention rate = (750 ÷ 1,000) × 100 = 75%
Benchmark Context
As a reference point, Gross Revenue Retention for startups with $1M–$5M ARR averaged 92% recently, down slightly from 95%. Comparing your retention to benchmarks like this helps investors understand whether you are performing above, at, or below expectations, and it helps you spot where retention work will have the biggest payoff.
Cohort-Based Retention Analysis
Cohort analysis, a method where you group customers by the time they first sign up, provides investors with detailed retention patterns over time rather than snapshot metrics that can be misleading.
Sample Cohort Retention Table:
Cohort curves that flatten and rise across months show retention improving as the product matures. Rising cohort retention signals stronger onboarding and product fit, which directly extends customer lifespan and LTV.
Advanced Retention Metrics
Beyond basic retention rates, investors value sophisticated metrics that provide operational insights:
- Revenue Retention Rate:
Measures retained revenue including upsells and expansion revenue, often exceeding 100% for successful SaaS companies. - Feature Adoption Retention:
Tracks retention of customers who adopt key product features, revealing product-market fit depth. - Engagement-Based Retention:
Measures active usage patterns rather than just subscription renewals, providing leading indicators of future churn.
In 2025, Net Revenue Retention for $1M–$5M ARR startups demonstrated a median of 104%, with the top quartile reaching 110%. These numbers underscore that high-performing companies not only retain revenue but achieve expansion beyond initial ARR. NRR above 100% means existing customers fund growth without new acquisition spend. A 110% NRR base grows 10% annually with zero new logos, before any marketing dollar lands. Investors often add 1x to 2x on the revenue multiple for companies sustaining that expansion. Hitting 104% is solid; clearing 110% reshapes what you can raise and at what dilution.
Consumer app founders can explore how these retention signals overlap with traction metrics in consumer apps that investors track during due diligence.
Creating Investor-Ready Presentations
For startups, proving retention and LTV to secure funding should be the central theme of your investor story. Effective investor presentations weave retention and LTV metrics into a compelling growth narrative rather than presenting them as isolated statistics.
Recommended Presentation Structure:
- Market Problem and Solution: Establish why customers need long-term value
- Customer Acquisition: Show how you attract the right customers
- Retention Excellence: Demonstrate product-market fit through retention data
- LTV Analysis: Quantify the economic value of customer relationships
- Growth Projections: Model future growth based on proven retention patterns
- Competitive Advantage: Explain why your retention rates exceed industry benchmarks
Comparing Gross and Net Revenue Retention
| Metric | Definition | Investor Implication |
|---|---|---|
| Gross Revenue Retention | Measures retained recurring revenue, excluding upsells and expansion. | Shows baseline customer stability and churn risk. |
| Net Revenue Retention | Includes upsell and expansion revenue, can exceed 100%. | Indicates growth from existing customers and product adoption. |
| Benchmark | 90%+ for mature SaaS companies. | 100%+ signals strong expansion and low churn. |
Early-stage founders still building their retention story can benefit from pre-seed funding strategies tailored to consumer startups.
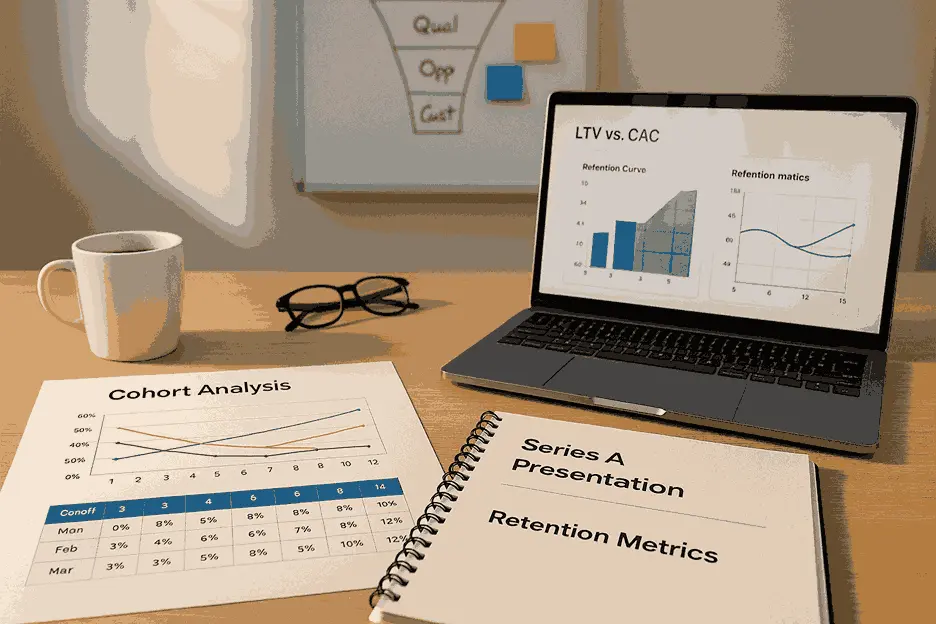
How to Present Data Visually?
Data visualization transforms complex metrics into compelling investor insights:
- Retention Curve Graphs: Show cohort retention over 12-24 months with trend lines indicating improvement over time.
- LTV:CAC Ratio Charts: Display the relationship between customer acquisition costs and lifetime value across different segments and time periods.
- Revenue Retention Waterfalls: Illustrate how expansion revenue from existing customers drives growth beyond new customer acquisition.
- Churn Rate Trends: Demonstrate decreasing churn rates over time as product improvements and customer success efforts take effect.
Supporting Data and Context
Investors appreciate retention and LTV metrics supported by additional context:
- Industry Benchmarks: Compare your metrics to industry standards and explain why your business outperforms or has potential for improvement.
- Customer Feedback: Include qualitative data explaining why customers stay loyal and what drives their long-term value.
- Product Roadmap: Connect retention improvements to specific product developments and customer success initiatives.
- Operational Metrics: Show how customer support response times, product reliability, and feature adoption correlate with retention rates.
Common Mistakes and How to Avoid Them
Inaccurate LTV calculations can destroy investor confidence in your analytical capabilities and business understanding.
Common Mistakes to Avoid:
- Using gross revenue instead of gross margin in LTV calculations, overstating actual value
- Ignoring churn rate acceleration as businesses scale and customer mix changes
- Calculating LTV over unrealistic timeframes without considering competitive dynamics
- Failing to segment LTV by customer type, masking important business insights
- Not accounting for expansion revenue in SaaS and subscription businesses
Presentation Pitfalls
How you present retention and LTV data can significantly impact investor perception:
- Misleading Time Periods: Using cherry-picked time periods that don’t represent sustainable trends undermines credibility with experienced investors.
- Vanity Metric Focus: Emphasizing total customer numbers rather than retained customer value suggests poor understanding of business fundamentals.
- Lack of Forward-Looking Analysis: Presenting historical data without projections based on retention trends misses opportunities to demonstrate growth potential.
- Insufficient Segmentation: Aggregated metrics that hide important customer behavior patterns prevent investors from understanding business dynamics.
Industry-Specific Considerations
1. SaaS and Subscription Businesses
SaaS companies typically demonstrate retention through multiple metrics that collectively paint a picture of customer stickiness:
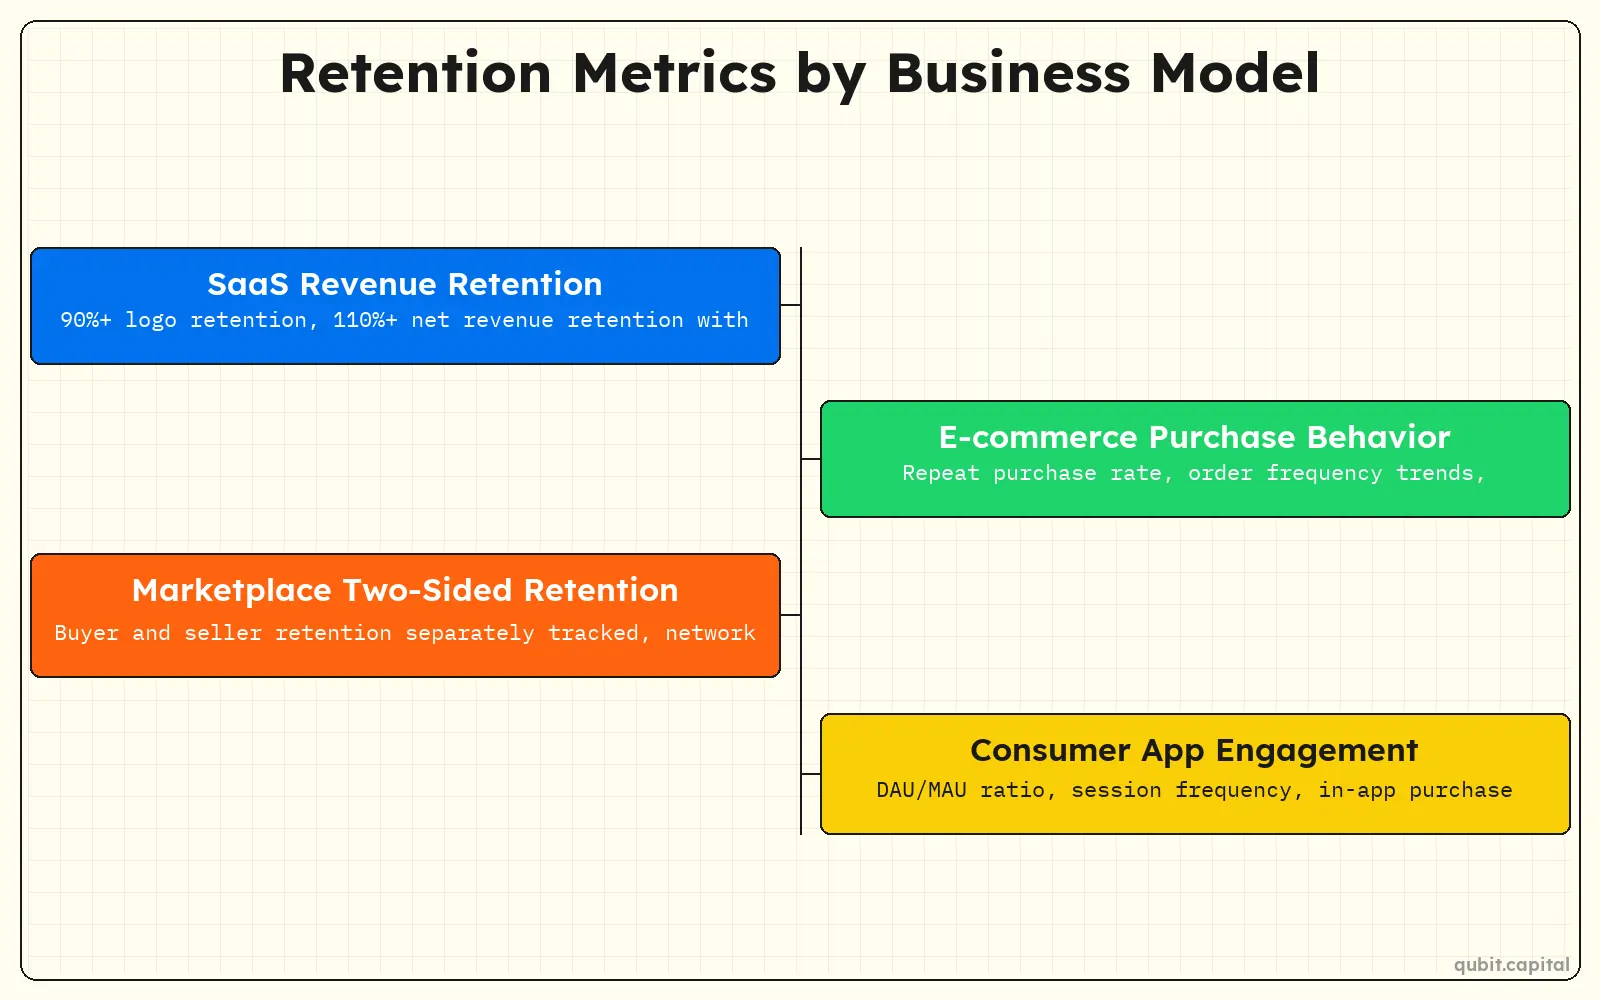
Key SaaS Retention Metrics:
- Monthly Recurring Revenue (MRR) retention
- Logo retention (customer count)
- Net revenue retention (including expansion)
- Feature adoption and usage patterns
- Customer health scores predicting retention
Investor Expectations:
- 90%+ annual logo retention for mature SaaS companies
- 110%+ net revenue retention indicating expansion revenue
- Decreasing churn rates over time as product improves
- Clear correlation between product usage and retention rates
2. E-Commerce and Marketplace Platforms
E-commerce businesses demonstrate retention through purchasing behavior and engagement patterns:
Critical E-commerce Metrics:
- Repeat purchase rate within specific timeframes
- Average order frequency and value trends
- Customer lifetime transaction volume
- Seasonal retention patterns and recovery
- Cross-selling and category expansion success
Marketplace-Specific Considerations:
- Two-sided retention for both buyers and sellers
- Network effects improving retention over time
- Transaction frequency and value growth patterns
- Platform dependency and switching costs
3. Consumer Applications and Services
Consumer-focused businesses require different retention measurement approaches:
Key Consumer Metrics:
- Daily/Monthly Active User retention
- Session frequency and duration patterns
- In-app purchase conversion and retention
- Social sharing and viral coefficient impact
- User-generated content contribution rates
Knowing which firms prioritize these metrics can help you target the right partners — see our list of top investors backing consumer startups.
Building Long-Term Retention and LTV
Sustainable retention and higher LTV come from deliberate choices across product, engagement, and customer support. The sections below outline practical approaches in each area that compound into stronger unit economics over time.
1. Product Development Strategies
Sustainable retention requires continuous product improvement aligned with customer needs and usage patterns.
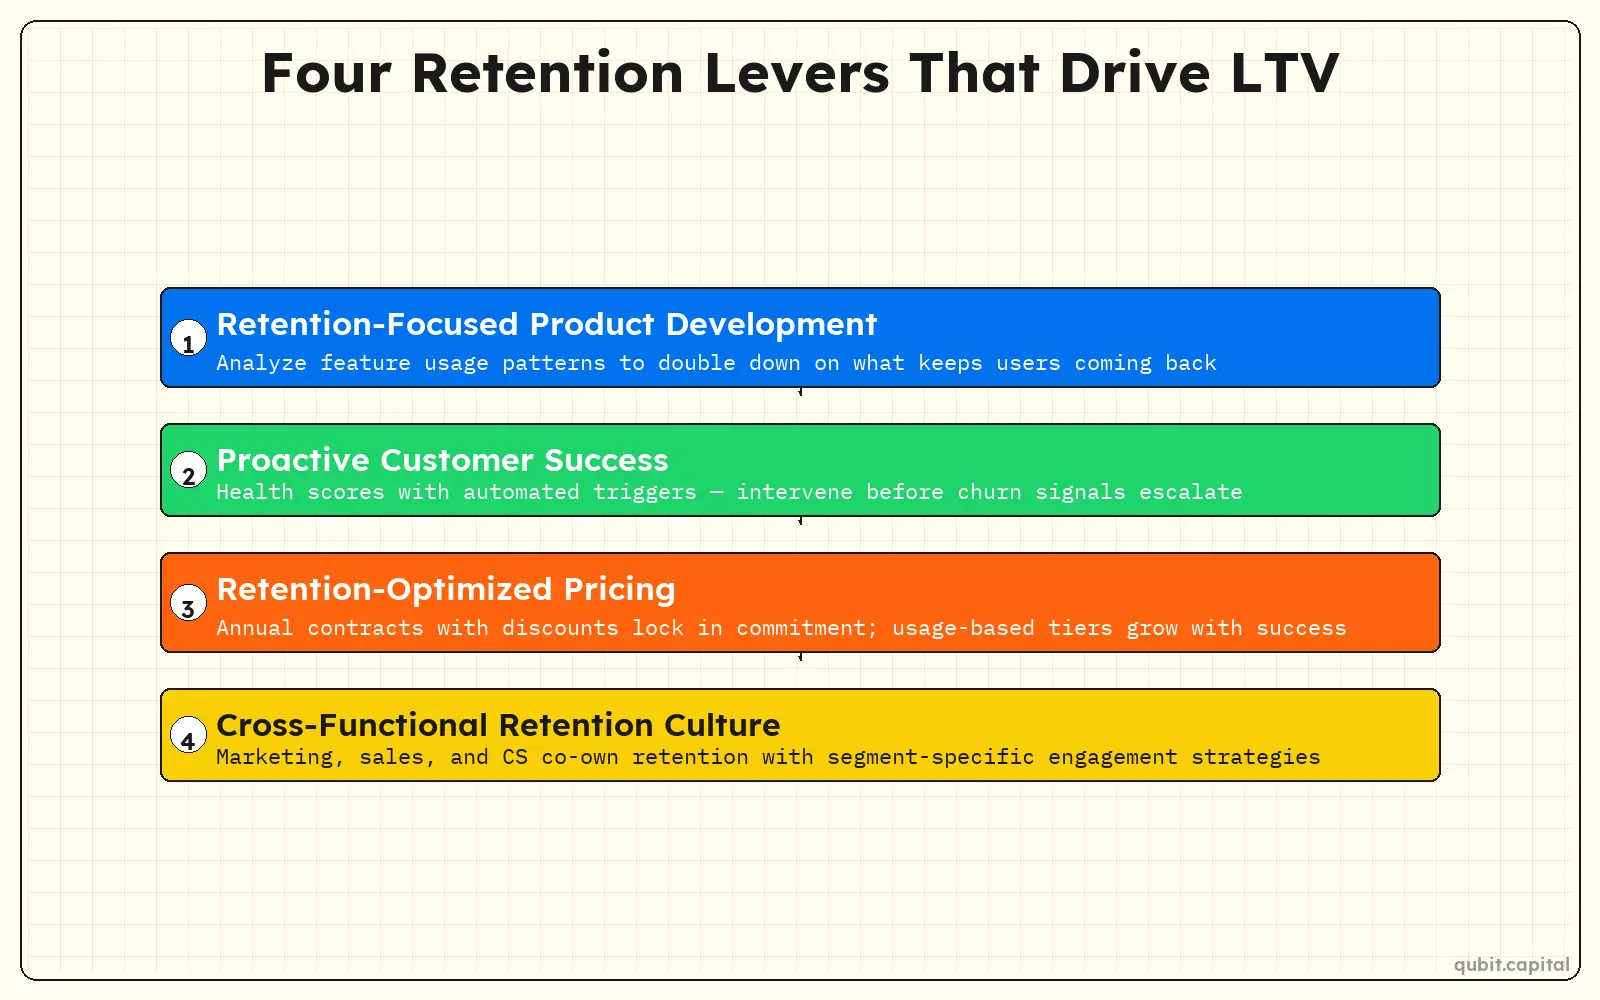
Retention-Focused Development:
- Feature Usage Analysis: Identify features correlated with high retention and prioritize similar development
- Onboarding Optimization: Reduce time-to-value and improve initial user experience
- Engagement Loop Design: Create product experiences that encourage regular usage and habit formation
- Customer Feedback Integration: Systematically incorporate user feedback into product roadmap decisions
2. Customer Success and Support
Proactive customer success programs significantly impact retention and LTV by identifying and addressing issues before they lead to churn.
Effective Customer Success Elements:
- Health score monitoring with automated intervention triggers
- Regular check-ins and business review sessions
- Educational content and training programs
- Expansion opportunity identification and execution
- Churn prediction and prevention workflows
3. Pricing and Packaging Optimization
Strategic pricing decisions directly influence both retention rates and customer lifetime value:
Retention-Optimized Pricing:
- Annual contracts with meaningful discounts to improve retention
- Usage-based pricing that grows with customer success
- Feature tiers that encourage upgrades over time
- Transparent pricing that builds trust and reduces churn
- Exit interview analysis to understand price sensitivity
4. Company-Wide Retention Initiatives
Retention is too expensive to leave with one team. Marketing, sales, and customer success should share a single retention KPI tied to revenue impact. Evaluate every team's budget request through net dollar retention, not just acquisition cost.
Measuring Success and Continuous Improvement
Tracking the right metrics turns retention from a guessing game into a repeatable discipline. The sections that follow cover which numbers to watch and how to use them to refine your approach.
1. Key Performance Indicators
Establish clear KPIs that connect retention and LTV improvements to business outcomes:
Primary KPIs:
- Customer Lifetime Value growth rate
- Retention rate improvement trends
- LTV:CAC ratio optimization
- Revenue per customer expansion
- Time to positive LTV achievement
Leading Indicators:
- Product engagement scores
- Customer health metrics
- Support ticket resolution rates
- Feature adoption velocity
- Customer satisfaction scores
To achieve sustainable growth, startups should target an LTV:CAC ratio of 4:1. For instance, $3,000 customer lifetime value and $750 CAC achieves this metric and demonstrates efficiency to investors.
Reporting and Analytics Infrastructure
Sophisticated retention and LTV analysis requires proper data infrastructure and reporting systems.
Essential Analytics Capabilities:
- Cohort Analysis Tools: Track customer behavior over extended periods
- Segmentation Platforms: Analyze retention patterns across customer dimensions
- Predictive Analytics: Identify customers at risk of churning before it happens
- Revenue Attribution: Connect customer actions to lifetime value outcomes
- Real-Time Dashboards: Monitor retention metrics with actionable alerts
Why CRM Data Quality Drives Retention Analytics
Building on the need for robust analytics infrastructure, maintaining clean and detailed CRM data is fundamental for accurate retention and LTV measurement. Reliable customer records enable precise segmentation, cohort analysis, and identification of retention drivers. Data integrity ensures that trends and insights generated by reporting tools reflect actual customer behavior rather than artifacts or errors. Prioritizing CRM quality empowers startups to optimize marketing, product, and support strategies based on trustworthy metrics.
Conclusion
Ultimately, proving retention and LTV to secure funding is the foundation for building investor trust and unlocking growth opportunities. Proving strong retention and lifetime value (LTV) metrics is essential for consumer startups aiming to secure early-stage and growth funding. These metrics provide investors with critical evidence of product-market fit, customer loyalty, and sustainable unit economics, factors that ultimately drive valuation and investment confidence.
Accurately measuring and presenting retention and LTV requires disciplined data collection, cohort analysis, and thoughtful segmentation to reveal deeper insights into customer behavior and business scalability.
Get your financials right the first time, explore our startup fundraising services service and let us help you build models that support your vision.
Key Takeaways
- Customer retention rates and LTV serve as critical proof points for sustainable business models that investors prioritize over vanity metrics.
- Proper LTV calculation includes average purchase value, frequency, customer lifespan, and gross margins with segmentation across channels and customer types.
- Cohort-based retention analysis demonstrates improving customer stickiness over time rather than misleading snapshot metrics.
- Effective investor presentations integrate retention and LTV into growth narratives with supporting context and industry benchmarks.
- Industry-specific retention metrics vary significantly between SaaS, e-commerce, and consumer applications requiring tailored measurement approaches.
Get your round closed. Not just pitched.
A structured fundraising process matched to your stage and investor fit.
- Fundraising narrative and structure that holds up
- Support from strategy through investor conversations
- Built around your stage, model, and timeline
Frequently asked Questions
How do cohort analyses improve investor confidence?
Cohort analyses group customers by sign-up date and track how each group retains over time. This reveals whether newer cohorts retain better than older ones. Investors see real product improvements rather than averaged snapshots. The detail proves your business is getting healthier as you scale. It also exposes weak periods you can explain with context.