 Back
Back


Table of Contents
If you are pitching a SaaS startup and your financial projections are just a hockey stick flying into the sky with no logic behind it, investors will spot the problem instantly. Big numbers without context do not signal ambition. They signal guesswork.
Strong financial projections are not about optimism. They show that you understand how your SaaS business actually makes money, acquires customers, and scales profitably. Investors want to see the system behind the growth, not just the outcome you hope for.
This matters more than ever. The global SaaS market is projected to reach $390.46 billion by the end of 2025, making competition intense and investor scrutiny even sharper. Metrics like Monthly Recurring Revenue, Customer Acquisition Cost, and Lifetime Value help investors judge whether your growth is sustainable or just expensive.
This article breaks down the financial projections and SaaS KPIs investors expect to see in a pitch deck, and how to present them with confidence. Let’s dive into the numbers that actually move decisions.
Why Financial Metrics Matter
Without diligent financial tracking, startups face steep odds. In fact, 82% of failures result from poor cash flow management. This underlines why presenting clear numbers and understanding your financial engine is non-negotiable for investor trust.
Before you dive into MRR or CAC calculations, ask yourself: Why bother? Because without hard numbers, your pitch deck is just art, pretty, but pointless.
Financial metrics are quantifiable measures used to assess a company’s financial health and performance.
- Builds Credibility
Investors hear “trust me” all day. Financial metrics are your receipts. A Customer Acquisition Cost (CAC) payback of 6 months instead of 12 shows you’ve done your homework. It signals you aren’t wasting money. - Reveals the Health of Your Engine
A soaring revenue curve might look great, but if churn is 10% monthly, you’re scooping water with a colander. Metrics like LTV and gross margin show whether you’re scaling sustainably—or if you’re on a crash course with Reality. - Guides Strategic Decisions
Should you double down on paid ads or switch budgets to content marketing? When you know your CAC by channel and your payback period, you can allocate dollars where they actually move the needle—rather than spraying and praying. - Frames the Investment Ask
“We need ₹2 Cr to grow” is a blank check request. But “We need ₹2 Cr to cut our CAC payback by 3 months and expand into two new markets” is a targeted mission. Investors love clarity about how their capital accelerates your growth.
Revenue Model Assumptions Behind SaaS Projections
Financial projections are only as credible as the revenue model beneath them. Investors expect founders to clearly state how revenue is generated and what assumptions drive growth.
Key elements include:
- Pricing model: subscription, usage-based, hybrid, or enterprise contracts
- Average contract value and expansion assumptions
- Sales motion: self-serve, sales-led, or product-led growth
- Renewal and upsell mechanics
Without explicit revenue logic, even accurate KPIs feel disconnected. Clear assumptions show that projections are engineered, not guessed.
Startups like yours already closed their rounds with us.
Founders across every stage and industry. Here's what it took.
- Raised $7.6M for Swiipr Technologies
- Raised $0.5M for Ap Tack
- Raised €0.5M for Ivent Pro

KPIs for Financial Health in SaaS Pitch Decks
Crafting a strong SaaS pitch deck depends on a clear story backed by credible financial KPIs. Investors expect to see a concise set of metrics that explain how the business grows, retains customers, and converts revenue into long-term value. Core SaaS KPIs typically include MRR, CAC, LTV, churn, retention, and gross margin.
When grouped into revenue, retention, and efficiency categories, these metrics give investors a fast, structured view of financial health. Together, they show whether growth is sustainable, customer economics make sense, and the business can scale profitably.
Segmenting Metrics for Deeper Insights
Beyond headline numbers, segmentation adds depth. Breaking down MRR, ARR, and churn by customer type, contract size, or pricing tier surfaces patterns that top-line metrics often hide. This analysis highlights which segments drive growth, where churn risk sits, and how revenue quality evolves. For investors, segmentation signals disciplined measurement and a mature understanding of unit economics.
Selecting actionable metrics goes beyond numbers. According to Founder Institute, 42% of startups collapse by misreading market demand, offering products customers never needed. Integrating metrics like MRR and ARR directly targets this pitfall, ensuring product-market fit evidence.
Customer and Employee Satisfaction Metrics
Alongside churn and retention rates, tracking customer satisfaction (NPS, CSAT) and employee engagement adds valuable context. High satisfaction scores often correlate with stronger retention and lower churn. These metrics also signal potential risks or opportunities before they appear in financial results. Including them demonstrates a holistic approach to business health.
Retention and churn metrics are critical for demonstrating the sustainability of your SaaS business. High retention rates and low churn indicate that customers find value in your product and are likely to stick around.
Implementing KPI-driven strategies yields measurable results. Dropbox grew from 100,000 to 4 million users in just 15 months by deploying a referral program tied to retention metrics. This example demonstrates how targeted metrics can directly impact user stickiness and rapid scaling.
Burn Rate and Cash Runway
Beyond efficiency metrics, tracking burn rate and cash runway is essential for SaaS startups. Burn rate measures monthly net cash outflow, while runway estimates how long funds will last at current spending levels. These metrics help investors gauge operational sustainability and the urgency of future fundraising. Clear runway projections build confidence in your financial planning.
Once your KPIs are locked in, the next question is where they sit inside the deck itself; this breakdown of the essential slides and story flow for a software pitch deck shows how financial metrics connect to traction, problem, and go-to-market slides so the numbers feel earned rather than dropped in.
Scenario Planning & Sensitivity Analysis
Scenario planning is essential for software startup KPI financial projections. It helps founders anticipate risks and adjust strategies. Failure rates climb when risk scenarios are ignored. In 2024, 966 startups shut down, a 25.6% increase over 2023. Scenario planning is crucial for survival in changing conditions.
Blind forecasts are boring, and risky. Show you’ve stress-tested your model with “what-ifs.” Highlight the key levers (e.g., a 1% churn change moves your runway by 2 months).
- Overly optimistic churn assumptions
- Ignoring seasonal effects
- Underestimating CAC spikes
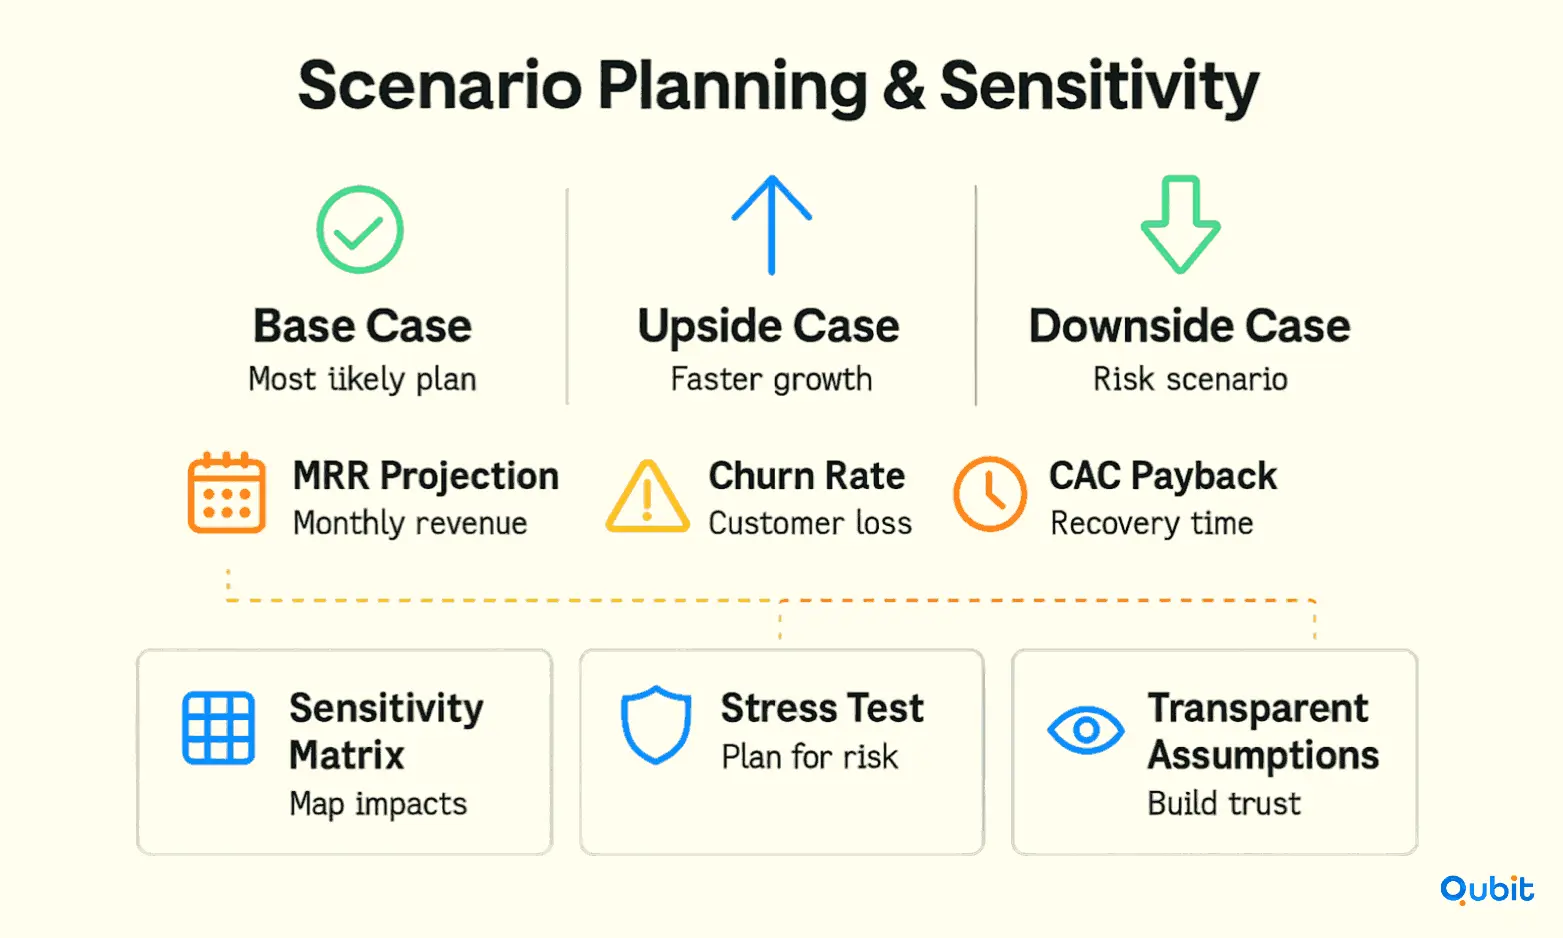
Suggested alt text: scenario planning 11zon — visual guide for software startup kpi financial projections
What to include
- Base case: Your most likely projection.
- Upside case: If growth accelerates (e.g., 20% higher MRR).
- Downside case: If churn or CAC spikes (e.g., 10% worse).
- Sensitivity matrix: Table showing how small changes in churn or CAC affect runway or profitability.
Why it matters
- Demonstrates you’ve thought through risks and won’t be caught flat-footed.
- Helps investors gauge their downside and upside before writing the check.
EXAMPLE:
| Aspect | Accelerator | Incubator |
|---|---|---|
| Duration | 3–6 months | 6–24 months |
| Equity | Typically 5–10% in exchange for funding | Often free or small equity stake |
| Focus | Rapid product-market fit and fundraising | Early-stage R&D, prototypes, workspace |
| Cohort Model | Fixed-term, group of startups | Flexible entry, individual pacing |
| Demo Day | Yes, culminating in investor pitch event | Rarely, with more ongoing showcase opportunities |
Financial projections software can help automate sensitivity analyses and visualize scenario outcomes. Your coverage of financial projections can also be paired with guidance from software pitch deck design tips, illustrating how visual storytelling can underscore key metrics. By combining clean data with strong storytelling elements, startups can create a compelling narrative that resonates with investors and stakeholders alike.
Maintaining data integrity is not just about accuracy; it’s about building trust and clarity. Startups that prioritize this aspect are better positioned to secure funding and drive sustainable growth.
How Investors Stress-Test Your Financial Projections
Investors rarely take projections at face value. They pressure-test assumptions to see how fragile or resilient the business model is.
Common investor challenges include:
- What happens if churn increases by 1–2%?
- How sensitive is growth to CAC inflation?
- Does revenue growth still hold if hiring slows?
Founders who proactively address these questions signal maturity. Stress-tested projections reduce perceived risk and shorten diligence cycles.
Benchmarking & Industry Comparisons
Benchmarking your key performance indicators for startups helps you measure progress against competitors. Compare your KPIs for financial performance against industry benchmarks for context.
Anchor those comparisons in recent data, not gut feel. The Benchmarkit 2025 SaaS Performance Metrics Report found the median CAC payback period stretched to 18 months in 2024, up from 14 months the prior year — so if your projections show a 12-month payback, investors will immediately read that as above-average efficiency, while anything past 24 months raises questions about whether the model scales profitably.
- What to include
- MRR growth rates: Compare your month-over-month or year-over-year growth to category leaders (e.g., 10–15% MoM for high-growth SaaS).
- CAC payback: Show where you land versus peers—are you faster, slower, or on par?
- Churn rates: 5–7% annual churn is typical for SMB-focused apps; 2–3% for enterprise.
- Why it matters
- Investors know the averages; beating them is a strong signal.
- If you’re below average, you can still spin it as upside—“we’ve optimized churn by X% since launch.”
- Quick example
- “Our 8% MoM MRR growth outpaces the 6% average in the SMB invoicing category. Our 7-month CAC payback is 2 months faster than the 9-month industry norm.”
- Tip
- Cite public reports (e.g., KeyBanc, Pacific Crest) or benchmarking surveys to back your claims.
Benchmarking SaaS financial metrics helps you understand your position in the market.
Linking Financial Projections To Fundraising Milestones
Financial projections are not just forecasts. They are fundraising roadmaps.
Investors expect projections to clearly connect capital raised to outcomes such as:
- Extended runway to a specific milestone
- Improved unit economics or payback period
- ARR targets that unlock the next valuation step
Strong decks show how funding converts into measurable progress, not just survival. This alignment turns projections into a capital efficiency narrative.
Conclusion
Financial planning for startups is a vital part of crafting an impactful pitch deck. Successful pitch decks rely on clear software startup KPI financial projections to build investor confidence. By focusing on clear messaging, structured flow, and visual appeal, you can effectively communicate your startup’s vision and value proposition to potential investors. Remember, every slide should serve a purpose, guiding your audience seamlessly through your narrative.
As you refine your pitch deck, prioritize clarity and brevity while ensuring your content resonates with your target audience
Whether it’s highlighting your market opportunity or showcasing your team’s expertise, each element should align with your overarching goals. Highlighting your financial performance metrics can make your pitch deck stand out.
We at Qubit Capital can help. Our Fundraising Assistance service streamlines your path to success. Let us partner with you to turn your vision into reality.
Key Takeaways
- Financial projections must explain the system behind growth, not just outcomes
- SaaS KPIs only matter when tied to a clear revenue model
- Segmentation reveals revenue quality, not just scale
- Burn rate and runway define fundraising urgency and leverage
- Scenario planning shows preparedness, not pessimism
- Investors stress-test assumptions before trusting projections
- Credible projections link capital raised to concrete milestones
Get your round closed. Not just pitched.
A structured fundraising process matched to your stage and investor fit.
- Fundraising narrative and structure that holds up
- Support from strategy through investor conversations
- Built around your stage, model, and timeline
Frequently asked Questions
How do financial projections help software startups secure investment?
Financial projections show investors that founders understand their revenue model, unit economics, and growth drivers. Credible numbers tied to assumptions — like CAC, churn, and MRR growth — prove the business can scale without running out of cash. Weak or unexplained projections are one of the fastest ways to lose investor trust.