 Back
Back


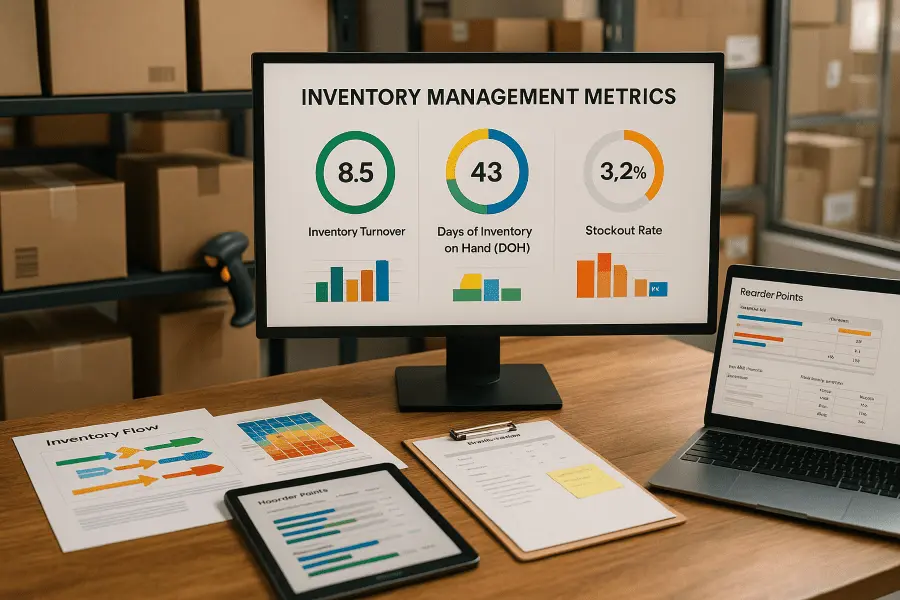
Table of Contents
The finance function plays a pivotal role in shaping the strategic direction of tech and SaaS businesses. Yet, many organizations struggle to assess its effectiveness. Is your finance team equipped to drive growth, optimize resources, and deliver actionable insights?
The urgency to optimize inventory is underscored by rapid sector growth. By 2024, global e-commerce sales surged to $6.09 trillion, marking an 8.4% rise from the previous year. This explosive expansion magnifies operational challenges and opportunities alike. Businesses must align inventory strategies with these market forces to stay competitive.
This blog explores the key inventory metrics that drive investor confidence and operational success. From unit economics to growth forecasts, we’ll uncover actionable strategies to refine your approach.
Ready to dive deeper into the metrics that matter? Let’s jump right in!
Ecommerce Inventory Metrics Investors Expect
Investors read inventory data as a cash flow forecast, not a warehouse report. Every unit on a shelf is capital you cannot spend on growth or runway. Tight inventory metrics show how fast each dollar cycles back, which shapes your valuation multiple.
Investors reviewing e-commerce companies prioritize metrics like inventory turnover, DIO, GMROI, stockout rate, and carrying cost. These indicators demonstrate operational efficiency and readiness for growth.
The growing importance of inventory management systems underscores this trend. The global e-commerce inventory management system market, valued at USD 3.45 billion in 2024, is projected to reach USD 11.50 billion by 2033. This surge reflects the increasing reliance on data-driven tools to streamline operations and attract investor interest.
Ultimately, presenting well-organized inventory metrics signals to investors that a business is not only operationally sound but also forward-thinking. By showcasing these metrics, e-commerce companies can build trust and secure the financial backing needed for long-term success. Investors price that signal directly. A business that turns inventory in 30 days needs far less working capital than one stuck at 90 days. That gap can mean the difference between raising at a 2x revenue multiple and a 4x one. Lower capital intensity also means less dilution per dollar of growth you fund.
Startups like yours already closed their rounds with us.
Founders across every stage and industry. Here's what it took.
- Raised $7.6M for Swiipr Technologies
- Raised $0.5M for Ap Tack
- Raised €0.5M for Ivent Pro

Key Ecommerce Inventory Metrics for Investors
As market benchmarks evolve, inventory turnover rates between 4 and 8 times per year are widely recognized as healthy for e-commerce. These values help investors quickly assess operational effectiveness. Regularly reviewing and targeting this range can clearly signal competitiveness. Turning 4 times a year means your capital sits idle for 90 days per cycle. Push to 8 times and that idle period drops to 45 days. On $1 million of inventory, that freed capital funds payroll instead of sitting on a shelf. Each extra turn is cash you do not have to raise and dilute for.
Let’s break down the ecommerce inventory metrics investors value most, explaining their significance, ideal benchmarks, and practical strategies for improvement.
When Standard Metrics May Mislead
Certain models or new businesses (like seasonal SKUs or launch-phase ventures) may need to adjust or supplement core inventory KPIs for better accuracy.
1. Inventory Turnover Ratio (Key Inventory KPI)
Inventory Turnover Ratio indicates how many times your inventory is sold and replaced within a specific period, typically one year.
Formula: Inventory Turnover Ratio=Cost of Goods Sold (COGS)Average Inventory\text{Inventory Turnover Ratio} = \frac{\text{Cost of Goods Sold (COGS)}}{\text{Average Inventory}}Inventory Turnover Ratio=Average InventoryCost of Goods Sold (COGS)
Why Investors Care:
Why Investors Care: Inventory KPIs such as turnover ratio help investors gauge operational efficiency and sales performance.
A higher ITR signals that your e-commerce business effectively manages stock without tying up unnecessary capital. Investors typically look for an ITR of 4 to 8 for e-commerce companies, although this can vary widely depending on your niche. Tied-up capital has a real cost beyond the cash itself. At a 20% cost of capital, $500,000 frozen in slow stock burns $100,000 a year. That is roughly a month of runway for an early-stage team. Investors discount that drag straight off your effective valuation.
Example:
Amazon, a leader in e-commerce, has consistently maintained a high inventory turnover ratio, averaging around 8.5 times per year, illustrating remarkable operational efficiency.
How to Optimize:
- Leverage predictive analytics to anticipate demand.
- Reduce slow-moving stock through targeted promotions.
- Negotiate shorter lead times with suppliers to manage just-in-time inventory.
2. Days Inventory Outstanding (DIO)
DIO measures how many days it takes, on average, to sell your inventory. Read DIO as cash locked in days. A 60-day DIO means every dollar of stock is unavailable for two months. Cut DIO by 20 days and you free a fifth of that cash permanently. For a cash-tight startup, those days translate directly into added runway.
Formula: DIO=Average InventoryCOGS×365\text{DIO} = \frac{\text{Average Inventory}}{\text{COGS}} \times 365DIO=COGSAverage Inventory×365
Why Investors Care:
A lower DIO indicates that your business effectively converts inventory into cash quickly. Investors favor startups with a DIO lower than their industry’s average, typically between 30 to 60 days in fast-paced e-commerce sectors. Faster conversion shortens your cash conversion cycle directly. A business below industry-average DIO often self-funds growth from its own cash. That means fewer outside rounds and less equity given away. Investors pay a premium for that lower capital intensity.
Example:
Fashion retailer ASOS reduced its DIO from 120 days down to about 45 days by adopting agile inventory strategies, dramatically improving cash flow and investor confidence.
How to Optimize:
- Regularly reassess your product mix.
- Implement dynamic pricing to accelerate turnover.
- Streamline restocking based on real-time data.
3. Gross Margin Return on Investment (GMROI)
GMROI measures your return for every dollar invested in inventory, emphasizing profitability relative to stock investment. Think of GMROI as the yield on your inventory balance sheet. A GMROI of 3 means every dollar in stock returns three in gross profit. Below 1, your inventory loses money before overhead even hits. Investors treat GMROI as a direct read on how well you allocate capital.
Formula: GMROI=Gross ProfitAverage Inventory Cost\text{GMROI} = \frac{\text{Gross Profit}}{\text{Average Inventory Cost}}GMROI=Average Inventory CostGross Profit
Why Investors Care:
A healthy GMROI demonstrates efficient inventory investment and profit maximization. Investors typically look for a GMROI greater than 2.5, indicating profitable inventory management.
Example:
E-commerce beauty brand Glossier maintains a high GMROI exceeding 4, driven by lean inventory strategies and high-margin products.
How to Optimize:
- Prioritize high-margin, fast-moving products.
- Reduce markdowns by accurately forecasting demand.
- Focus on supplier negotiations to lower purchasing costs.
4. Stockout Rate
The stockout rate indicates how often your products are unavailable when customers attempt to make a purchase.
Formula: Stockout Rate=Number of stockoutsTotal demand occurrences×100\text{Stockout Rate} = \frac{\text{Number of stockouts}}{\text{Total demand occurrences}} \times 100Stockout Rate=Total demand occurrencesNumber of stockouts×100
Why Investors Care:
High stockout rates negatively impact customer experience and revenue. Industry benchmarks recommend maintaining a stockout rate below 3% to prevent substantial revenue losses. Price the stockout, not just the missed sale. A 5% stockout rate on $4 million in demand is $200,000 of revenue gone. At a 4x revenue multiple, that is $800,000 shaved off valuation. Repeat stockouts also raise churn, which compounds the loss every quarter.
Example:
In 2022, Shopify reported that businesses experiencing frequent stockouts faced average revenue losses of nearly 12% annually, emphasizing the significance of maintaining adequate stock levels.
How to Optimize:
- Implement automated inventory management software.
- Enhance supplier relationships for quicker replenishment.
- Use predictive analytics to anticipate peak sales periods accurately.
5. Carrying Cost of Inventory
Carrying costs encompass all expenses associated with holding inventory, including storage, insurance, taxes, and obsolescence.
Formula (Annual): Carrying Cost=Total Inventory Holding CostsAverage Inventory Value×100\text{Carrying Cost} = \frac{\text{Total Inventory Holding Costs}}{\text{Average Inventory Value}} \times 100Carrying Cost=Average Inventory ValueTotal Inventory Holding Costs×100
Why Investors Care:
High carrying costs drain profitability and reflect inefficient inventory control. Investors prefer startups maintaining annual carrying costs at or below 20–30% of total inventory value. Carrying cost is a silent burn on your runway. At 25% on $1 million of inventory, you spend $250,000 a year just to hold stock. That is capital that never reaches growth or product. Trimming carrying cost by 10 points often adds a full quarter of runway.
Example:
According to the National Retail Federation, carrying costs typically account for 20–30% of the inventory value annually for retail and e-commerce businesses. Effective control strategies can notably reduce these expenses.
How to Optimize:
- Regularly review inventory to reduce obsolete or excess stock.
- Negotiate storage and insurance rates.
- Utilize dropshipping or fulfillment centers to minimize storage costs.
Note: For dropshipping models, traditional carrying cost calculations may not apply directly.
We encourage you to apply these strategies to refine your inventory management practices. If you’re looking to transform your metrics into investor-ready insights, consider partnering with us. Explore our Investor Discovery and Mapping service to unlock tailored solutions for your business.
KPI Ownership and Accountability in Inventory Management
Building on these inventory metrics, assigning clear ownership for each KPI is critical for maintaining data integrity and driving improvement. Designating responsible team members ensures regular monitoring and swift response to metric deviations. This accountability structure helps prevent oversight and supports a culture of continuous operational enhancement. Consistent ownership also reassures investors that key metrics are actively managed and aligned with business goals.
Pairing inventory turnover data with a well-structured unit economics and financial model gives investors a fuller picture of how efficiently capital flows through your operations.
Ecommerce KPIs for Business Success
Understanding the right ecommerce inventory metrics is crucial for e-commerce businesses aiming to thrive in a competitive landscape. These metrics are even more vital considering scale. By 2025, global online retail sales are projected to surpass $7.4 trillion. This targets a rapidly enlarging market. Businesses measuring the right KPIs stand to capture greater growth during this expansion. A market that large rewards capital efficiency over raw spend. The companies that turn inventory fastest fund expansion from cash, not new equity. That self-funded growth is what earns the higher multiple in this expansion.
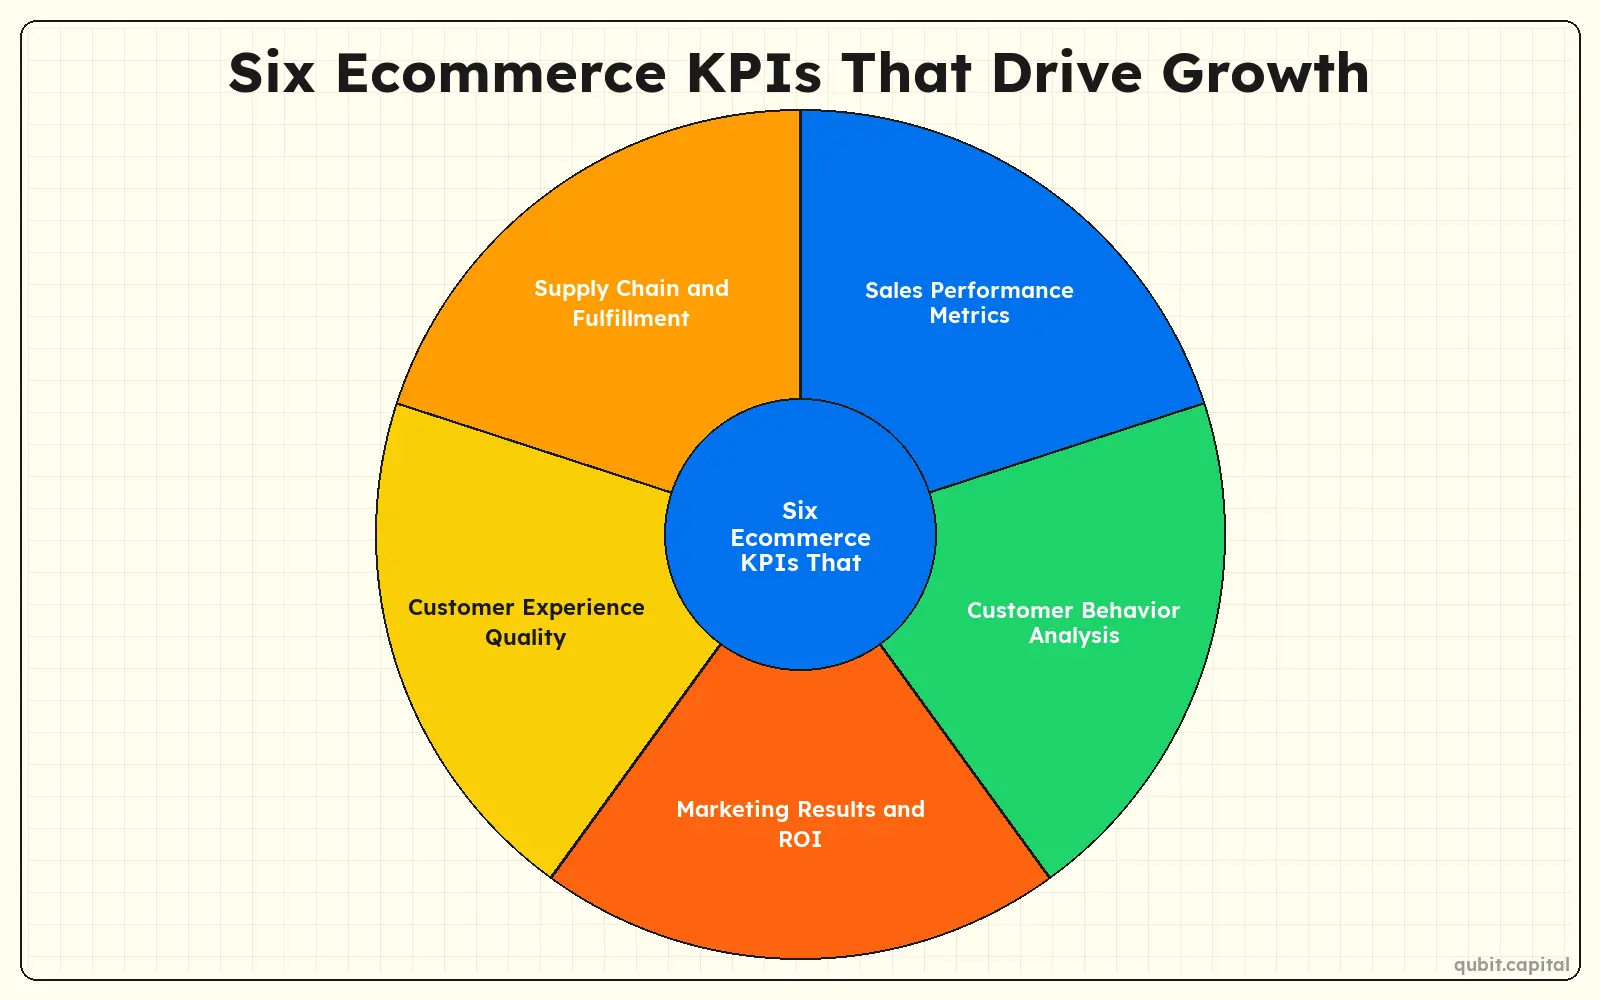
Monitoring performance across six key ecommerce KPIs, sales performance, customer behavior, marketing results, customer experience, supply chain efficiency (including fulfillment KPIs), and cash flow management, provides actionable insights to drive growth.
1. Sales Performance
Sales metrics reveal the health of your revenue streams. Track metrics like average order value (AOV), conversion rates, and total sales to identify trends and opportunities. Comparing month-on-month and year-on-year data adds depth to your analysis, helping you spot seasonal patterns or long-term growth trajectories.
2. Customer Behavior
Analyzing customer behavior metrics, such as cart abandonment rates and repeat purchase frequency, helps you understand how shoppers interact with your store. These insights can guide strategies to improve retention and optimize the buyer journey.
3. Marketing Results
Evaluate the effectiveness of your campaigns by monitoring metrics like return on ad spend (ROAS), click-through rates (CTR), and customer acquisition costs (CAC). These figures highlight which marketing channels deliver the best results, enabling smarter budget allocation.
4. Customer Experience
Customer satisfaction metrics, including Net Promoter Score (NPS) and customer reviews, reflect how well your brand meets expectations. A positive experience fosters loyalty and encourages word-of-mouth referrals.
5. Supply Chain Efficiency
Efficient inventory management and order fulfillment are critical. Metrics like order accuracy and delivery times ensure your supply chain supports customer satisfaction while minimizing operational costs.
6. Cash Flow Management
Cash flow metrics, such as operating cash flow and days payable outstanding, ensure your business remains financially stable. Regular monitoring helps you anticipate challenges and maintain liquidity. Cash flow is runway measured in real time. Stretching days payable outstanding from 30 to 45 days frees half a month of operating cash. That delay is effectively a free loan from suppliers. Investors read strong cash flow discipline as fewer emergency raises at bad terms.
Inventory figures rarely stand alone when an early-stage store goes out to raise. Investors read them alongside unit economics, so presenting turnover and sell-through next to LTV / CAC benchmarks for e-commerce seed rounds shows how operational discipline translates into durable customer value.
Making Metrics Meaningful
Understanding inventory metrics is essential for businesses aiming to attract investor confidence. However, the true value lies in interpreting these metrics in ways that provide actionable insights. By segmenting data effectively, companies can present a clearer picture of their operations and growth potential, especially when tracking inventory accuracy KPIs.
Segmenting by market scale reveals distinct opportunities. For example, global retail sales topped $27 trillion in 2022 and are forecasted to exceed $30 trillion in 2024. Regional analysis uncovers where growth surges outpace global averages, justifying granular performance monitoring.
1. Cycle Counts and Inventory Accuracy Audits
Beyond effective segmentation, implementing regular cycle counts and inventory accuracy audits is essential for reliable reporting. These processes help identify discrepancies, reduce shrinkage, and ensure fulfillment data remains trustworthy. Accurate inventory records prevent costly stockouts or overstock situations. Establishing routine audits reinforces operational discipline and supports investor confidence in reported metrics.
2. Geographic Segmentation: a Strategic Advantage
Breaking down inventory metrics by geography can reveal trends that might otherwise remain hidden. For instance, comparing regional performance can highlight areas of strength or pinpoint regions requiring strategic adjustments. This approach not only enhances transparency but also demonstrates a company’s ability to adapt to market-specific challenges. Investors are more likely to trust businesses that showcase granular insights into their operations, as this reflects a deeper understanding of market dynamics.
3. Unit Economics: the Foundation of Business Viability
Unit economics tell investors whether growth makes you money or just burns it faster. If contribution margin is negative, every new order shortens your runway. Investors stress-test this number first, because it sets the ceiling on your sustainable valuation.
By combining geographic segmentation with unit economics, businesses create a compelling narrative. This strategy resonates with investors.
Beyond interpreting inventory data, preparing your e-commerce startup for investment requires aligning these segmented insights with the broader financial story investors want to see.
What Tools Optimize Inventory Metrics?
For 2025, leading inventory tools will offer real-time tracking, forecasting, and smooth order management. For a scaling startup, that visibility converts directly into freed working capital and longer runway. These tools now track and improve your inventory metrics:
The accuracy gains here are documented well beyond vendor claims. McKinsey found that applying AI-driven forecasting to supply chain management can reduce forecasting errors by 20 to 50 percent and cut lost sales from product unavailability by up to 65 percent. For an investor, that range matters more than the tool name: it turns a soft "AI helps" pitch into a defensible estimate of how much working capital and lost revenue a forecasting upgrade actually recovers.
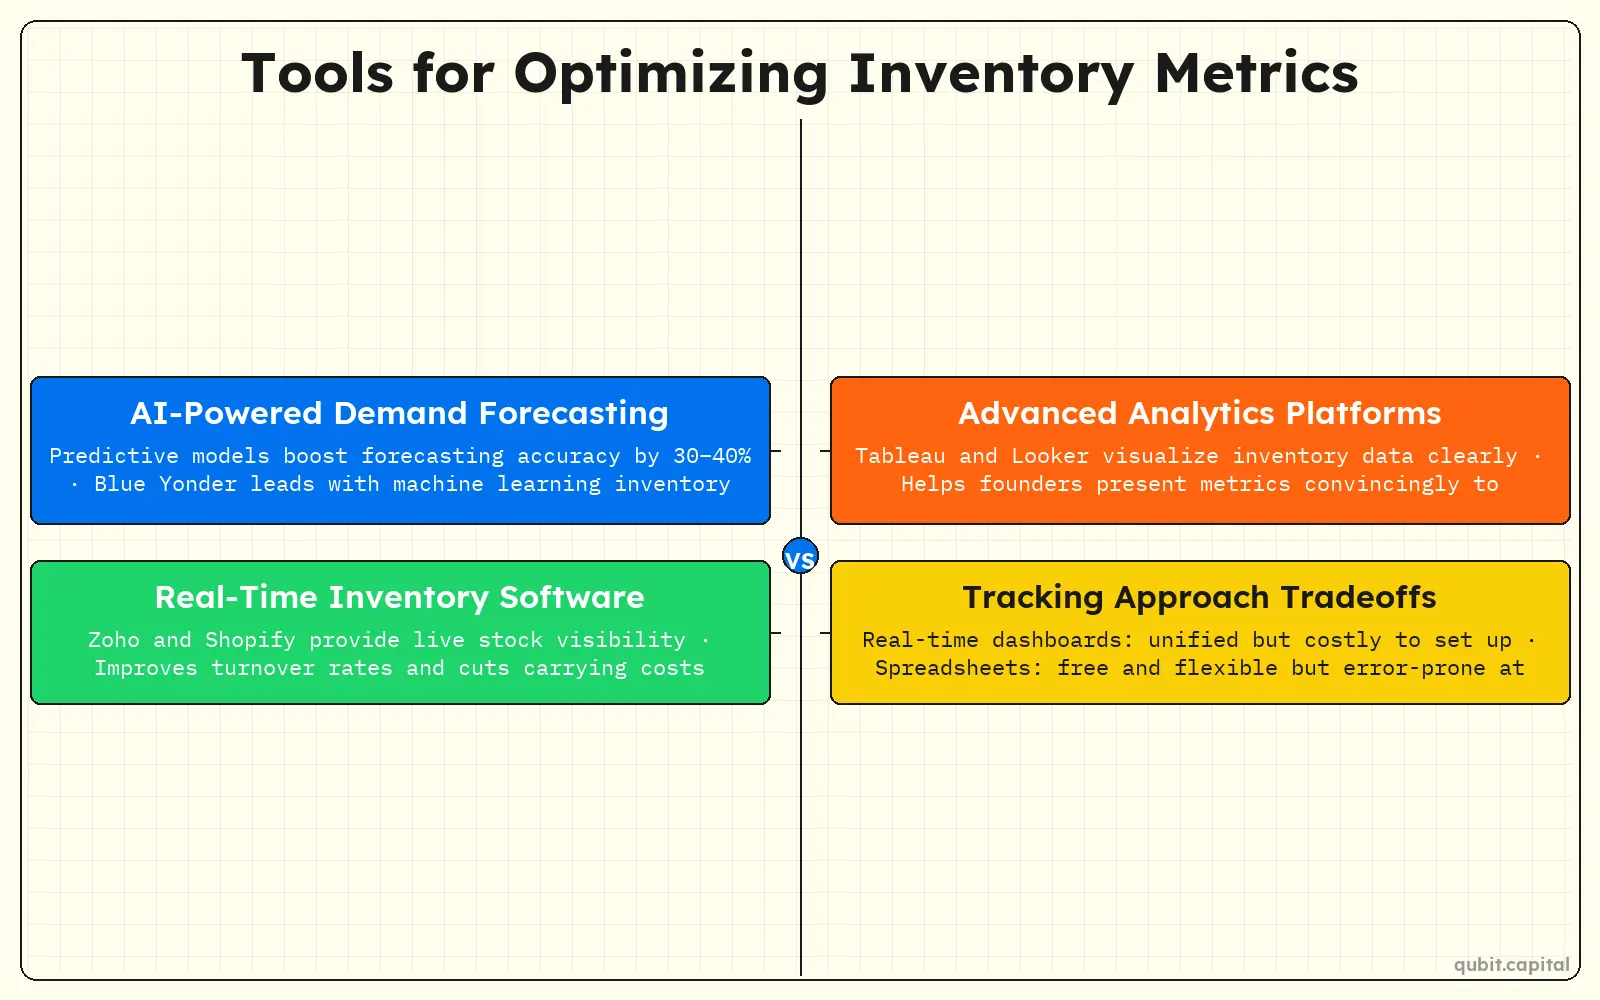
- AI-Powered Demand Forecasting: Companies like Blue Yonder claim predictive models can increase forecasting accuracy by 30–40%.
- Real-Time Inventory Management Software: Solutions such as Zoho Inventory and Shopify Inventory provide visibility to improve turnover rates and reduce carrying costs.
- Advanced Analytics Platforms: Tools like Tableau or Looker enable comprehensive data visualization, helping founders clearly communicate metrics to investors.
Comparing Inventory Metric Tracking Approaches
| Approach | Strengths | Limitations |
|---|---|---|
| Integrated Real-Time Dashboards | Unified data, instant updates, supports strategic decisions | Higher cost, requires technical setup and training |
| Manual Spreadsheet Tracking | Low cost, flexible for small operations, easy to start | Prone to errors, limited scalability, time-consuming updates |
| Basic Reporting Tools | Simple to use, accessible for most teams, quick setup | Limited customization, slower insights, less integration |
Accurate inventory forecasting also feeds directly into your go-to-market plan and growth forecast, ensuring demand projections match the operational capacity your tools reveal.
Conclusion
Achieving operational efficiency requires a strategic approach to ecommerce inventory metrics and a clear, data-driven narrative. Throughout this blog, we’ve explored key strategies and metrics that can help businesses optimize their processes and present compelling insights to investors. From understanding inventory turnover rates to implementing advanced forecasting techniques, these methods are essential for maintaining a competitive edge.
A well-structured inventory system not only enhances operational performance but also builds investor confidence. By focusing on measurable outcomes and aligning inventory metrics with business goals, companies can effectively demonstrate their potential for growth and scalability.
If you’re looking to turn inventory discipline into investor confidence, at Qubit we understand demand forecasting, stock turns, and working-capital math. Show traction with our ecommerce fundraising assistance and map a capital plan that scales.
Key Takeaways
- Consistent tracking of inventory metrics boosts investor confidence for ecommerce businesses.
- Key areas include sales performance, customer behaviour, marketing effectiveness, supply chain operations, and cash flow management.
- Advanced technologies and AI can significantly reduce forecasting errors.
- A detailed breakdown of key ecommerce metrics provides actionable insights for operational improvement.
- Effective segmentation of ecommerce metrics and KPIs drives strategic decision-making.
Get your round closed. Not just pitched.
A structured fundraising process matched to your stage and investor fit.
- Fundraising narrative and structure that holds up
- Support from strategy through investor conversations
- Built around your stage, model, and timeline
Frequently asked Questions
What is the most important ecommerce inventory metric for investors?
Inventory turnover ratio is the single most watched metric for ecommerce investors. It shows how many times stock sells and replenishes within a period. A rate between 4 and 8 times per year signals healthy demand. Investors use it to judge operational discipline and how well capital converts into sales.